BANKNIFTY TRADING PLAN – 03-Nov-2025
📊 Prepared by LiveTradingBox | Based on 15-min chart structure & psychological correction theory
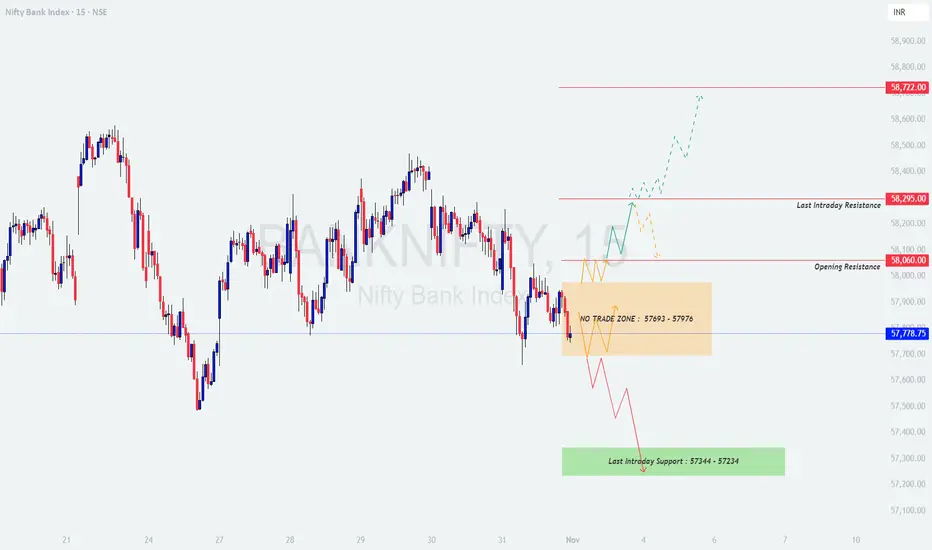
🔍 Key Reference Levels:
🟩 Last Intraday Support: 57,344 – 57,234
🟧 No Trade Zone: 57,693 – 57,976
🟨 Opening Resistance: 58,060
🟥 Last Intraday Resistance: 58,295
🔺 Profit Booking Zone: 58,722
🟢 1. Gap-Up Opening (Above 58,060 – 200+ points)
If Bank Nifty opens above 58,060, it reflects a bullish sentiment driven by overnight momentum or positive global cues. However, the key test will be whether the index can sustain above this breakout zone or not.
Plan of Action:
📘 Educational Insight:
Chasing a gap-up is one of the most common retail trader mistakes. Professionals wait for confirmation near resistance retests or structure validation to ensure they’re aligning with institutional flow rather than speculative enthusiasm.
🟦 2. Flat Opening (Around 57,750 ±100 points)
A flat start near the midpoint of the No Trade Zone (57,693 – 57,976) indicates indecision and balance between buyers and sellers. Patience is crucial here, as this range acts as a neutral ground where false signals can easily trap traders.
Plan of Action:
📘 Educational Insight:
Flat openings are where discipline and patience pay off. Avoid trading “inside noise” — wait for price to leave the neutral range with conviction before joining the move.
🔻 3. Gap-Down Opening (Below 57,600 – 200+ points)
A gap-down below 57,600 signals weakness or profit booking, especially if it’s accompanied by negative global cues. The support zone of 57,344 – 57,234 becomes the key area to watch for buyer reactions.
Plan of Action:
📘 Educational Insight:
Gap-downs often trigger emotional selling among retail participants. However, observing price reactions at support zones helps identify whether the move is panic-driven or part of a larger corrective phase.
🧠 Risk Management Tips for Options Traders:
📈 Summary & Conclusion:
⚠️ Disclaimer:
I am not a SEBI-registered analyst. This analysis is intended purely for educational and informational purposes. Traders and investors should perform their own research or consult with a financial advisor before taking any trading or investment decisions.
📊 Prepared by LiveTradingBox | Based on 15-min chart structure & psychological correction theory
🔍 Key Reference Levels:
🟩 Last Intraday Support: 57,344 – 57,234
🟧 No Trade Zone: 57,693 – 57,976
🟨 Opening Resistance: 58,060
🟥 Last Intraday Resistance: 58,295
🔺 Profit Booking Zone: 58,722
🟢 1. Gap-Up Opening (Above 58,060 – 200+ points)
If Bank Nifty opens above 58,060, it reflects a bullish sentiment driven by overnight momentum or positive global cues. However, the key test will be whether the index can sustain above this breakout zone or not.
Plan of Action:
- [] Wait for the first 15–20 minutes to let early volatility settle.
[] A retest and strong candle close above 58,060 can trigger fresh buying opportunities.
[] Initial targets will be 58,295 (last intraday resistance) and then 58,722 (profit booking zone).
[] Maintain a stop loss below 57,950 on an hourly close basis for positional trades. - If Bank Nifty rejects from 58,295 with heavy volume, consider partial profit booking or a light counter short scalp targeting 58,000 – 57,900.
📘 Educational Insight:
Chasing a gap-up is one of the most common retail trader mistakes. Professionals wait for confirmation near resistance retests or structure validation to ensure they’re aligning with institutional flow rather than speculative enthusiasm.
🟦 2. Flat Opening (Around 57,750 ±100 points)
A flat start near the midpoint of the No Trade Zone (57,693 – 57,976) indicates indecision and balance between buyers and sellers. Patience is crucial here, as this range acts as a neutral ground where false signals can easily trap traders.
Plan of Action:
- [] Avoid entering immediately after the open — the market needs time to reveal direction.
[] Wait for a breakout above 57,976 for potential upside movement toward 58,060 – 58,295.
[] A breakdown below 57,693 may trigger weakness toward 57,344 – 57,234.
[] Do not trade within the No Trade Zone to avoid choppy moves and unnecessary losses. - Focus on candle confirmations — avoid pre-empting breakouts or breakdowns.
📘 Educational Insight:
Flat openings are where discipline and patience pay off. Avoid trading “inside noise” — wait for price to leave the neutral range with conviction before joining the move.
🔻 3. Gap-Down Opening (Below 57,600 – 200+ points)
A gap-down below 57,600 signals weakness or profit booking, especially if it’s accompanied by negative global cues. The support zone of 57,344 – 57,234 becomes the key area to watch for buyer reactions.
Plan of Action:
- [] Monitor price behavior near 57,344 – 57,234. If Bank Nifty forms a strong bullish reversal candle (hammer or engulfing), it can offer a potential intraday long setup.
[] Targets for such a bounce can be 57,600 – 57,800, but avoid overextending trades unless strong momentum follows.
[] Keep a strict stop loss below 57,200 to protect from deeper slides.
[] If the support fails to hold and price sustains below 57,234, expect continued weakness toward 57,000 – 56,850 levels. - Avoid aggressive averaging — trend continuation can accelerate in such cases.
📘 Educational Insight:
Gap-downs often trigger emotional selling among retail participants. However, observing price reactions at support zones helps identify whether the move is panic-driven or part of a larger corrective phase.
🧠 Risk Management Tips for Options Traders:
- [] Never enter trades based on emotions — use defined entry and exit levels.
[] Avoid buying options during the first 15 minutes of the session; volatility premium is highest then.
[] Prefer ATM or slightly ITM options for directional trades — they offer better delta control.
[] Stick to a maximum risk limit of 2–3% per trade.
[] If you hit your daily loss limit, step aside and protect your capital — survival > prediction.
[] Keep monitoring time decay, especially post 2 PM — theta accelerates rapidly.
📈 Summary & Conclusion:
- [] Above 58,060, trend bias is bullish toward 58,295 – 58,722, provided the level sustains.
[] Between 57,693 – 57,976, stay neutral — it’s a No Trade Zone; let direction confirm.
[] Below 57,600, expect weakness until support near 57,344 – 57,234 reacts.
[] Patience, observation, and disciplined execution are key to consistent results.
⚠️ Disclaimer:
I am not a SEBI-registered analyst. This analysis is intended purely for educational and informational purposes. Traders and investors should perform their own research or consult with a financial advisor before taking any trading or investment decisions.
إخلاء المسؤولية
لا يُقصد بالمعلومات والمنشورات أن تكون، أو تشكل، أي نصيحة مالية أو استثمارية أو تجارية أو أنواع أخرى من النصائح أو التوصيات المقدمة أو المعتمدة من TradingView. اقرأ المزيد في شروط الاستخدام.
إخلاء المسؤولية
لا يُقصد بالمعلومات والمنشورات أن تكون، أو تشكل، أي نصيحة مالية أو استثمارية أو تجارية أو أنواع أخرى من النصائح أو التوصيات المقدمة أو المعتمدة من TradingView. اقرأ المزيد في شروط الاستخدام.