Through 2019 Bitcoin has once again proven to be the best performing asset available to the masses, far surpassing the expectations of even the most bullish commentators in the space.
A staggering recovery from lows around $3.2k of 2018, accelerated through to highs of 13.8k - around 4x to its peak.
After such an impressive move to the upside, one which fast approaches the previous all-time high after an 85% correction, it would be reasonable to expect that some selling pressure would be faced. This was seen particularly at the 61.8% text book short interest level, which is where the breaks were put on this run to date. I haven’t shown this on the chart because i refer to 61.8% in a different way later, but the same thing happened back in the previous bear market recovery.
Some other things to note - we hit a bottom in this cycle and bounced from it quicker than in previous cycles. This is likely to be as a result of more interest & awareness in the halvening. I have discussed the importance in this and the role i think it will play on creating a floor price above $6500. With additional fiat onramps and media & political attention and a general aura of interest, bitcoin appears to be gathering momentum from an infrastructure and credibility point of view. Whether the credibility leads to acceptance is another matter, but i suspect that it is inevitable.
As ive mentioned in some modelling shared on twitter, the combination of accelerated demand / interest / awareness, married across a limited supply, creates the perfect storm for bitcoin to achieve much higher prices and the opportunity for them to be achieved rather quickly. This is of course assuming there is no major black swan event (likely being USA, EU, G8 bans bitcoin.
So to summarise, im of the view that bitcoin has the infrastructure, the interest and the fundamentals to go higher, assuming there is no major banning event.
On to the TA. Typically bottom-new tops are found by rounding off the previous bear market, reason being that the down trend goes through previous support and once the bottom is found it generally becomes resistance on the way back up. Bitcoin has done a great job of destroying resistance on the way up, but as i mentioned its reached a technical level where its likely to run out of steam and into the face of the market shorters.
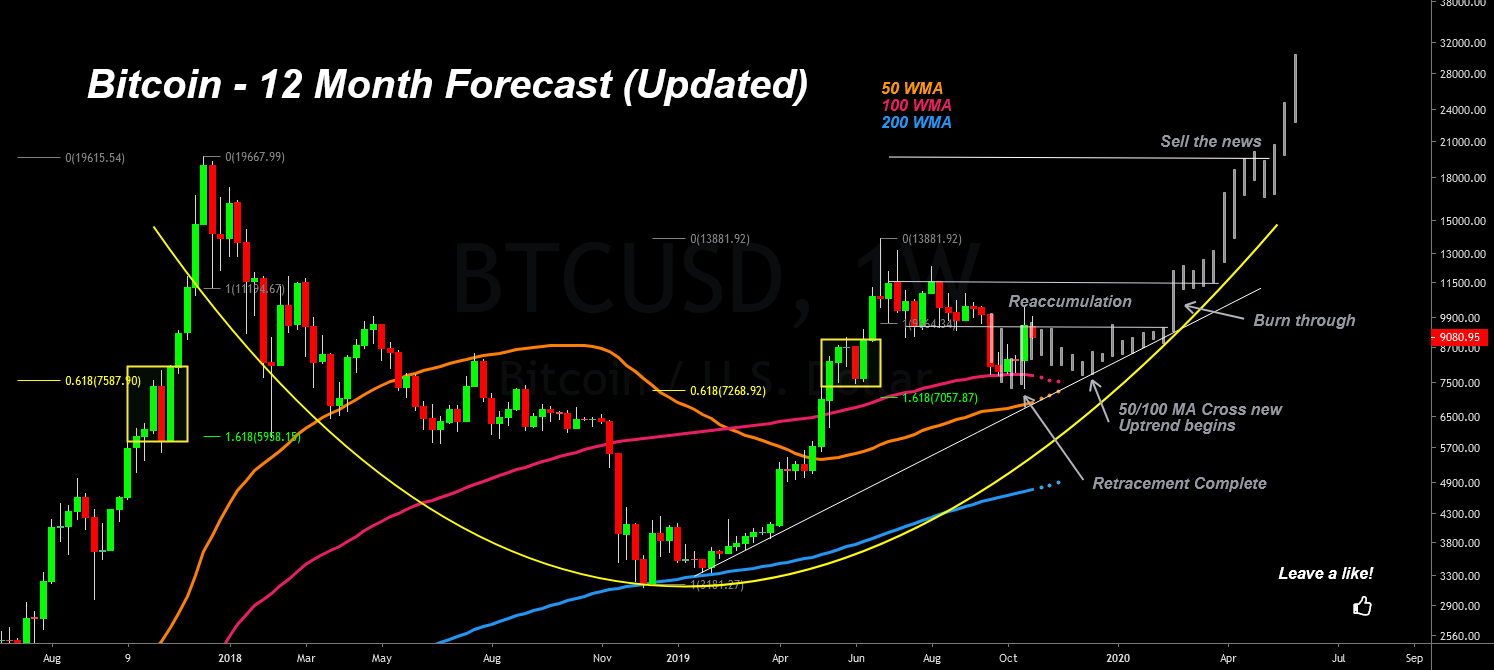
I am of the opinion that the bottom is in and we are in the smart money / stealth phase of the new cycle (see attached charts however, looking historically bitcoin likes to do a few things - parabolas break down and retrace at least 61.8% of their height, and typically this bounce occurs where there has been really strong buying interest on the way up. We can see that this occurred around the 6k level in 2017, with an engulfing candle on the weekly - we have seen this on the way up in 2019 and it is also at the 61.8% retracement level. This is also the 1.18 off the top. I.e. I’m of the view that bitcoin will correct into the 7ks.
Another thing Bitcoin likes to do, is its time from the top to the bottom typically is half the time it takes before a new all-time high is reached. I am therefore theorising that we will see the same, or similar as he have done previously.
We probably need to consolidate for some time before the halving.. Perhaps move sideways as i have illustrated, but ultimately im suggesting that we will pushing for new all-time highs earlier in 2020, at the time of the halving. I suspect that this will invoke a new bull market - as absurd as it sounds.. people like buying new all-time highs ; for confirmation. so ultimately that’s it;
- Retrace from here to 61.8%
- Consolidate the remainder of the year 7.5k-10k
- Exit rounding bottom / Cup and handle Summer 2020 following a "sell the news" event when halving occurs.
- Bull market cycle to follow thereafter
See below for previous charts referenced herein and follow on twitter for more updates etc.
Remember to like this if you found it of use and get accumulating that corn!
Best - filb
A staggering recovery from lows around $3.2k of 2018, accelerated through to highs of 13.8k - around 4x to its peak.
After such an impressive move to the upside, one which fast approaches the previous all-time high after an 85% correction, it would be reasonable to expect that some selling pressure would be faced. This was seen particularly at the 61.8% text book short interest level, which is where the breaks were put on this run to date. I haven’t shown this on the chart because i refer to 61.8% in a different way later, but the same thing happened back in the previous bear market recovery.
Some other things to note - we hit a bottom in this cycle and bounced from it quicker than in previous cycles. This is likely to be as a result of more interest & awareness in the halvening. I have discussed the importance in this and the role i think it will play on creating a floor price above $6500. With additional fiat onramps and media & political attention and a general aura of interest, bitcoin appears to be gathering momentum from an infrastructure and credibility point of view. Whether the credibility leads to acceptance is another matter, but i suspect that it is inevitable.
As ive mentioned in some modelling shared on twitter, the combination of accelerated demand / interest / awareness, married across a limited supply, creates the perfect storm for bitcoin to achieve much higher prices and the opportunity for them to be achieved rather quickly. This is of course assuming there is no major black swan event (likely being USA, EU, G8 bans bitcoin.
So to summarise, im of the view that bitcoin has the infrastructure, the interest and the fundamentals to go higher, assuming there is no major banning event.
On to the TA. Typically bottom-new tops are found by rounding off the previous bear market, reason being that the down trend goes through previous support and once the bottom is found it generally becomes resistance on the way back up. Bitcoin has done a great job of destroying resistance on the way up, but as i mentioned its reached a technical level where its likely to run out of steam and into the face of the market shorters.
I am of the opinion that the bottom is in and we are in the smart money / stealth phase of the new cycle (see attached charts however, looking historically bitcoin likes to do a few things - parabolas break down and retrace at least 61.8% of their height, and typically this bounce occurs where there has been really strong buying interest on the way up. We can see that this occurred around the 6k level in 2017, with an engulfing candle on the weekly - we have seen this on the way up in 2019 and it is also at the 61.8% retracement level. This is also the 1.18 off the top. I.e. I’m of the view that bitcoin will correct into the 7ks.
Another thing Bitcoin likes to do, is its time from the top to the bottom typically is half the time it takes before a new all-time high is reached. I am therefore theorising that we will see the same, or similar as he have done previously.
We probably need to consolidate for some time before the halving.. Perhaps move sideways as i have illustrated, but ultimately im suggesting that we will pushing for new all-time highs earlier in 2020, at the time of the halving. I suspect that this will invoke a new bull market - as absurd as it sounds.. people like buying new all-time highs ; for confirmation. so ultimately that’s it;
- Retrace from here to 61.8%
- Consolidate the remainder of the year 7.5k-10k
- Exit rounding bottom / Cup and handle Summer 2020 following a "sell the news" event when halving occurs.
- Bull market cycle to follow thereafter
See below for previous charts referenced herein and follow on twitter for more updates etc.
Remember to like this if you found it of use and get accumulating that corn!
Best - filb
تعليق:
"Miners Bottom"


تعليق:
Breakdown:

تعليق:
Smart Money Phase

تعليق:

تعليق:

تعليق:

تعليق:
I have slightly changed my 12 month forecast and I make no apologies for that.
The benefit of having more data as time passes is that that we can make a better assessment and any decent trader will tell you that to be profitable, you need to avoid marrying your view of the market and need to be flexible enough to make measured amendments to your view and position, whilst also not making knee jerk reactions.
The below is an extract from my newsletter which is issued weekly for free. I cannot link it here but if interested see my twitter or DM me.
1. Bitcoin Market Technical Analysis – Why I’m now a bull.
What happened this week;
In last week’s letter I remained overall marginally bearish due to the weekly chart at the time of writing, but I stated that Bitcoin would almost certainly move towards $11k over the weekend, which is ultimately exactly what happened with us finishing last week with a high on Sunday of $11.1k
What followed was that the lower time frame Adam and Eve market structure came into play and did not play out as a trap as I was concerned about, with Bitcoin sailing across $11k and on to the $12.2k initial target we discussed, being the 1.618 of the bottoming pattern, which coincided with the downward sloping resistance.
Fortunately I managed to trade up to the $11k last week and also catch some of the move to $12k, but it was not the entire move and not optimal size due to caution; but that is fine.
As I mentioned on Twitter, my view of the market has been reformed and there’s a few of reasons why that is. I will cover these off in each stage below I’m only focussing on the bigger picture this week.
تعليق:
Why I’m a bull;
i) The Weekly Bitcoin Chart and overall market Structure shift
The weekly bitcoin chart below is obviously not complete at the time of writing, but as it is in my view, quite profound.
i) The Weekly Bitcoin Chart and overall market Structure shift
The weekly bitcoin chart below is obviously not complete at the time of writing, but as it is in my view, quite profound.
تعليق:
Support / Resistance;
The main key support and resistance lines which now stretching and impacting across annual timeframes. It’s clear that Bitcoin is consolidating up against the $11.8k resistance found in Q1 2018. This is occurring off the back of a double bottom at $9.5k which is now acting as relatively well tested weekly support, in what has been a very strong 2019 bull market and within what appears to be a giant bullish pennant. Consolidation below resistance is generally considered to be bullish in a market postured bullish.
We have also now broken across $12k in four different weeks across the last seven; Bitcoin did not behave like this in Q1 2018 and attempts to break through $11.8k were instantly hammered down. Therefore it is difficult to suggest anything other than Bitcoin repeatedly knocking at the door of $12k is bullish
Market Structure
Market Structure clearly illustrates that Bitcoin is forming a bullish pennant. The minimum target for this is also the next significant weekly historic resistance at $16k. This is also a multi month pennant, which is supported by a back breaking rejection of the lows found in 2018. A quick glance to the left and the 2018 collapse in Price illustrates that once bitcoin continually tested in the $12k level, it broke to the downside. We are literally on the other side of this today.
Volume
OBV - As some of you know, my weapon of choice when doing TA is the OBV because it illustrates the cumulative effect of volume and price over time. As I demonstrate on the chart; a breakout of the OBV trend on the weekly has basically predicted all of the most significant market moves over the last 18 Months and now it is showing a break to the upside, alongside the pennant. This is really significant to me and as long as the weekly remains a green candle, with more volume to go for the week, it will be a bigger breakout than currently shown.
VPVR – Here I am referring to the volume traded through price down the right hand side of the chart. You can see that there is a decent amount of volume now traded at price levels below which should invoke buying interest, whereas above, there is a big void in history. This is significant as it was at $6k. We were well aware at $6k that there wasn’t much below in the way of volume through price support and that proved to be a major issue, until we found history at $3k. This should play out the same above, in particular, above 12k there is virtually nothing there to stop us from being close to price discovery.
The reason why it is important because there is virtually no one who bought above these levels and its highly likely none of these people are still holding on to their position looking to now sell, therefore it is probable that no one has any pressing reason to sell up here.
This is bullish as far as i am concerned and concludes what I believe to be a fairly compelling review of the weekly.
On lower timeframes, the Adam and Even target remains to play out, with $12.9k being the target. I am long and strong at spot and plan to remain so going forward unless there is a fundamental change to the above. I will look to be leveraging as we cross $12k, targeting $13k, after which I’m looking at $16k as a key level. A close above $12k this week would be ridiculously bullish in my opinion.
ii) Macro events unfolding and the correlation between BTC, Precious metals and CNY.
I won’t go into this in great detail mainly because it has already been covered extensively by others, but I will mention the key points;
Bitcoin’s correlation to Gold has doubled in recent times amidst the precious metals being retreated to as a safe haven. This can only be a bullish sign for Bitcoin now being viewed as being a useful diversification alongside traditional flight to safety capital outlets.
تعليق:
The devaluation of the Chinese currency saw an almost play by play correlation response on the Bitcoin chart and many see it as being inflows directly to bitcoin to avoid capital controls. Whether this is directly the case or not, I don’t know and ive seen commentators complaining that it might just be speculation that that is what is supposed to happen and therefore it is not necessarily relevant. Irrespective of whether there was a direct flow, I personally think that it is obviously significant because the point is that if people think that, then these sorts of things are in the minds of people for a reason and that usually leads to self-fulfilling outcomes. It will also be interesting to see what the impact of a potential no-deal BREXIT may bet in the same vein.
Negative Bond Yields. Something I briefly touched on in the Telegram channel, but ultimately when the yield curves are negative it means that investors are so desperate to find somewhere safe to put their money, that they are willing to take a haircut on it. This is a terrible sign for longer term global market sentiment on investment outlook. Although Bitcoin is very volatile – for the last ten years it’s been the most upwardly volatile asset readily on offer to the world and to boot; its ultimately halving its fixed inflationary output next year – this has got to attract capital. I will however mention that if there is another 2008 implosion, safe haven assets also depreciated due to a necessity to liquidate in order to meet short term liabilities, so its unclear how Bitcoin would perform but clearly overall; its bullish Bitcoin.
iii) Following a re-review of my previous analysis into the impact Tether Market Cap issuance has on Bitcoin price. (see letter)
تعليق:
Analysis moved over to here
FREE Telegram Channel ⏩⏩⏩ t.me/cryptotraider
GET MY INDICATORS; www.decentrader.com/?ref=51
Follow on Twitter @filbfilb
GET MY INDICATORS; www.decentrader.com/?ref=51
Follow on Twitter @filbfilb