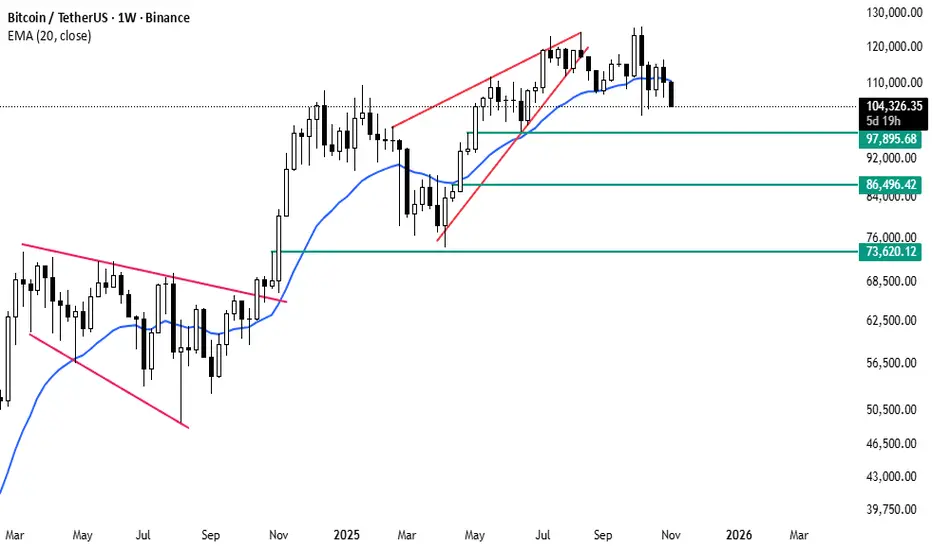
Bitcoin is currently trading around $104,500, showing signs of weakness after failing to maintain the highs near $120,000. The weekly chart suggests that price is testing the 20 EMA, which has acted as dynamic support throughout the recent bullish trend.
If the current consolidation continues, possible pullback zones can be found at:
As long as Bitcoin remains above the 20 EMA, the broader trend stays bullish. However, a clear weekly close below this average could open the door for a deeper correction toward the lower support levels.
This phase looks like a healthy retracement within the long-term uptrend, but confirmation from upcoming weekly candles will be crucial.
If the current consolidation continues, possible pullback zones can be found at:
- $97,900 – minor support and the first reaction level
- $86,500 – major support aligned with previous demand area
- $73,600 – key structural level from the last breakout base
As long as Bitcoin remains above the 20 EMA, the broader trend stays bullish. However, a clear weekly close below this average could open the door for a deeper correction toward the lower support levels.
This phase looks like a healthy retracement within the long-term uptrend, but confirmation from upcoming weekly candles will be crucial.
إخلاء المسؤولية
The information and publications are not meant to be, and do not constitute, financial, investment, trading, or other types of advice or recommendations supplied or endorsed by TradingView. Read more in the Terms of Use.
إخلاء المسؤولية
The information and publications are not meant to be, and do not constitute, financial, investment, trading, or other types of advice or recommendations supplied or endorsed by TradingView. Read more in the Terms of Use.