Here's the analysis of chart:
Bitcoin (BTC/USDT) 4-Hour Chart Analysis
1. Price Action & Trend
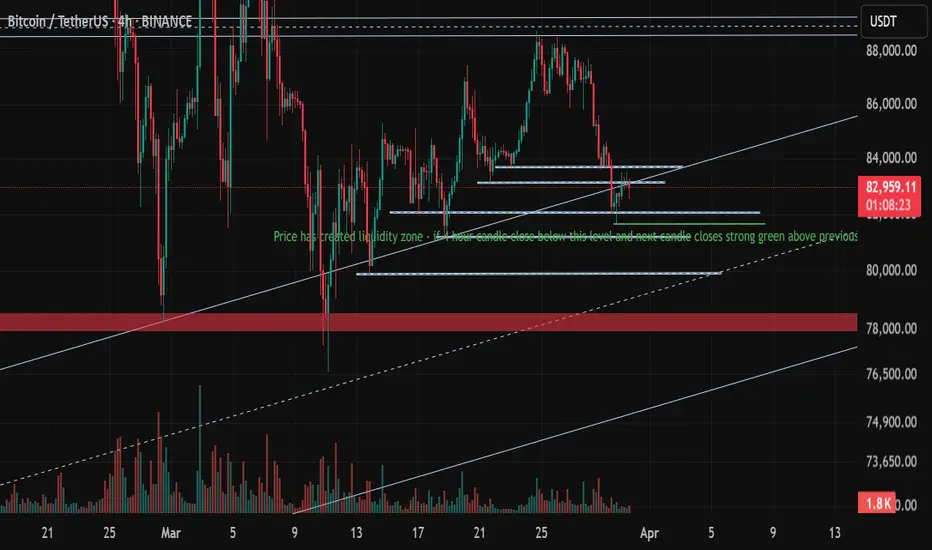
o The price is currently at $82,823.27, showing a minor decline of -0.35%.
2. Liquidity Zone & Key Support Levels
o A liquidity zone has been identified, as mentioned in the chart text.
Buying Condition - If a 4-hour candle closes below this level and the next candle forms a strong bullish reversal, it may signal a buying opportunity.
o The near support $81,000 is a significant support area, aligning with the major trendline support.
3. Volume & Market Strength
o Volume is relatively low, which suggests that current price movements might lack strong momentum.
o A volume increase near support or resistance levels could indicate a decisive move.
Trading Outlook
• Bullish Scenario: If BTC holds above the liquidity zone and prints a strong green candle, it could move higher towards $84,000 - $86,000 - $90,000
• Bearish Scenario: A breakdown below liquidity support could lead BTC to test the $78,000 region before finding strong demand.
Follow me for more such ideas.
This analysis is for educational purposes only and should not be considered financial advice. Trading involves significant risk, and past performance does not guarantee future results.
Disclaimer - Before entering any trade, ensure that all criteria and conditions outlined in the analysis are met. Always use a stop-loss to protect your capital and apply proper risk management strategies. Trade responsibly and at your own discretion.
Bitcoin (BTC/USDT) 4-Hour Chart Analysis
1. Price Action & Trend
o The price is currently at $82,823.27, showing a minor decline of -0.35%.
2. Liquidity Zone & Key Support Levels
o A liquidity zone has been identified, as mentioned in the chart text.
Buying Condition - If a 4-hour candle closes below this level and the next candle forms a strong bullish reversal, it may signal a buying opportunity.
o The near support $81,000 is a significant support area, aligning with the major trendline support.
3. Volume & Market Strength
o Volume is relatively low, which suggests that current price movements might lack strong momentum.
o A volume increase near support or resistance levels could indicate a decisive move.
Trading Outlook
• Bullish Scenario: If BTC holds above the liquidity zone and prints a strong green candle, it could move higher towards $84,000 - $86,000 - $90,000
• Bearish Scenario: A breakdown below liquidity support could lead BTC to test the $78,000 region before finding strong demand.
Follow me for more such ideas.
This analysis is for educational purposes only and should not be considered financial advice. Trading involves significant risk, and past performance does not guarantee future results.
Disclaimer - Before entering any trade, ensure that all criteria and conditions outlined in the analysis are met. Always use a stop-loss to protect your capital and apply proper risk management strategies. Trade responsibly and at your own discretion.
تم فتح الصفقة
The trade is activated after the closure of the 4-hour candle, but due to low volume, we will wait for a retracement before entering. The $82,000 level will act as support.إخلاء المسؤولية
لا يُقصد بالمعلومات والمنشورات أن تكون، أو تشكل، أي نصيحة مالية أو استثمارية أو تجارية أو أنواع أخرى من النصائح أو التوصيات المقدمة أو المعتمدة من TradingView. اقرأ المزيد في شروط الاستخدام.
إخلاء المسؤولية
لا يُقصد بالمعلومات والمنشورات أن تكون، أو تشكل، أي نصيحة مالية أو استثمارية أو تجارية أو أنواع أخرى من النصائح أو التوصيات المقدمة أو المعتمدة من TradingView. اقرأ المزيد في شروط الاستخدام.