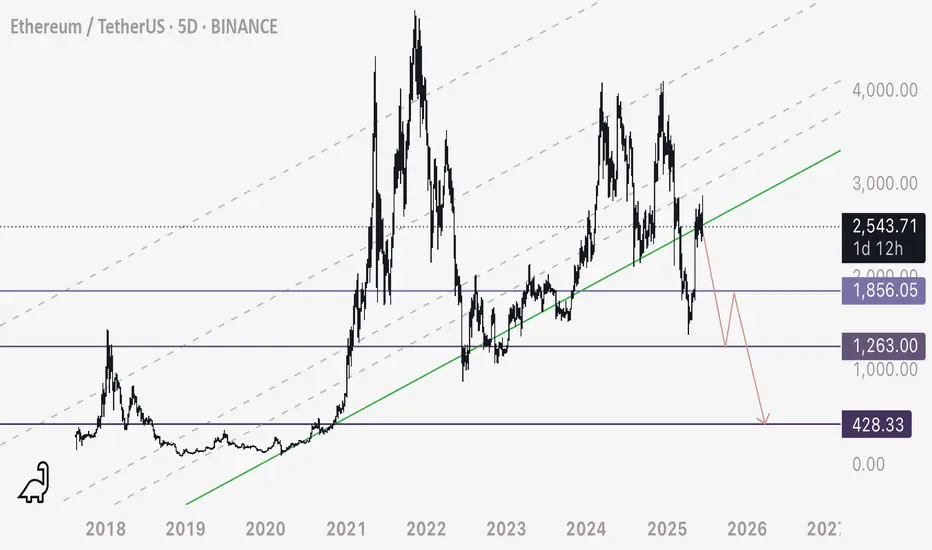
ETH on the multi day time frame appears to have been respecting this ascending series of support / resistances since its inception.
If this resistance holds, this is a major breakdown of ETH’s last support - assuming the chart does work best on these ascending channels (certainly has historically).
Due to this I am shorting ETH at 2550 appx - and my targets are marked on the chart (3 purple levels).
I don’t see why any formation on the chart should be dismissed if it has a strong interaction historically.
Let’s see what happens.
Happy trading
إخلاء المسؤولية
لا يُقصد بالمعلومات والمنشورات أن تكون، أو تشكل، أي نصيحة مالية أو استثمارية أو تجارية أو أنواع أخرى من النصائح أو التوصيات المقدمة أو المعتمدة من TradingView. اقرأ المزيد في شروط الاستخدام.
إخلاء المسؤولية
لا يُقصد بالمعلومات والمنشورات أن تكون، أو تشكل، أي نصيحة مالية أو استثمارية أو تجارية أو أنواع أخرى من النصائح أو التوصيات المقدمة أو المعتمدة من TradingView. اقرأ المزيد في شروط الاستخدام.