M&M Fin (W): Bullish, Breakout with Short-Term Rejection
(Timeframe: Weekly | Scale: Logarithmic)
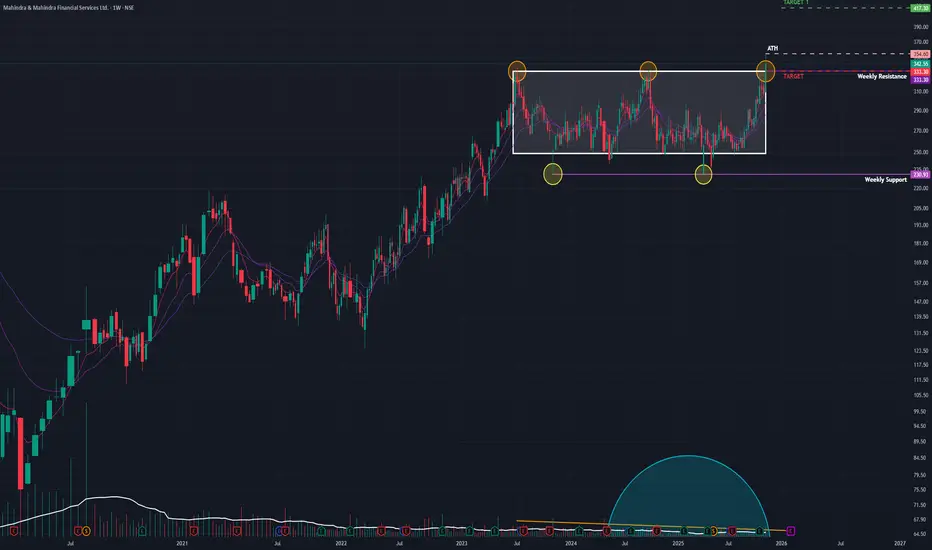
The stock has confirmed a major multi-year breakout, moving into "Blue Sky" territory. However, the daily price action suggests a temporary pullback (re-test) is imminent before the uptrend resumes.
📈 1. The Breakout Structure (The "Big Picture")
- The Setup: The stock has been trapped in a consolidation phase since its July 2023 peak. The ₹330–₹335 zone acted as a rigid "ceiling" for over two years.
- The Breakout: The week of Nov 17 was decisive. The stock surged 10.98%, closing above this multi-year resistance for the first time.
- Volume: The move was backed by 29.74 Million in volume—a significant expansion compared to the "dry" consolidation phase, confirming institutional participation.
🕯️ 2. The "Shooting Star" Warning (Daily Chart)
- The Pattern: The last daily candle (Friday) formed a Shooting Star. It opened high, rallied to a new peak (~₹354), but faced heavy selling pressure to close near the lows (~₹342).
- Implication: This "long upper wick" shows that sellers are aggressively defending the ₹350+ level. It strongly suggests that the breakout is "tired" and a re-test of the breakout zone is likely next week.
🚀 3. The Fundamental Catalyst (The "Why")
This technical move is supported by strong fundamentals, which adds confidence to the long-term bullish view:
- Earnings: The breakout is a delayed reaction to strong Q2 FY26 results, where Net Profit surged ~54% YoY and asset quality improved.
- Outlook: This fundamental strength suggests that any dip (re-test) will likely be bought by smart money.
📊 4. Indicators & Trend
- RSI & EMAs: RSI is rising (bullish momentum) and EMAs are in PCO state (trend alignment) across Monthly and Weekly charts. This confirms the primary trend is UP.
🎯 5. Future Scenarios & Key Levels
The "Shooting Star" dictates the immediate game plan: Wait for the Re-test.
🐂 The Bullish Case (Buy the Dip)
- The Strategy: Watch for the stock to pull back to the ₹333 – ₹335 zone (the resistance-turned-support).
- Confirmation: If the price stabilizes or forms a bullish candle (like a Hammer) at this level, it is a high-probability entry.
- Target 1: ₹417
- Target 2: ₹475
🐻 The Failure Case (Fakeout)
- Trigger: If the selling pressure from the Shooting Star intensifies and the stock closes back below ₹333.
- Consequence: This would confirm a "fakeout" (bull trap), and the stock could slide back toward the consolidation midpoint around ₹300.
Conclusion
The breakout is genuine, but the Shooting Star signals a short-term pause. The ideal approach is to wait for the re-test at ₹335 to confirm that the "ceiling" has truly become a "floor."
Disclaimer: This analysis is my personal view & for educational purposes only. They shall not be construed as trade or investment advice. Before making any financial decision, it is imperative that you consult with a qualified financial professional.
منشورات ذات صلة
إخلاء المسؤولية
لا يُقصد بالمعلومات والمنشورات أن تكون، أو تشكل، أي نصيحة مالية أو استثمارية أو تجارية أو أنواع أخرى من النصائح أو التوصيات المقدمة أو المعتمدة من TradingView. اقرأ المزيد في شروط الاستخدام.