بيع
NCASH/BTC Daily (Ascending Triangle)
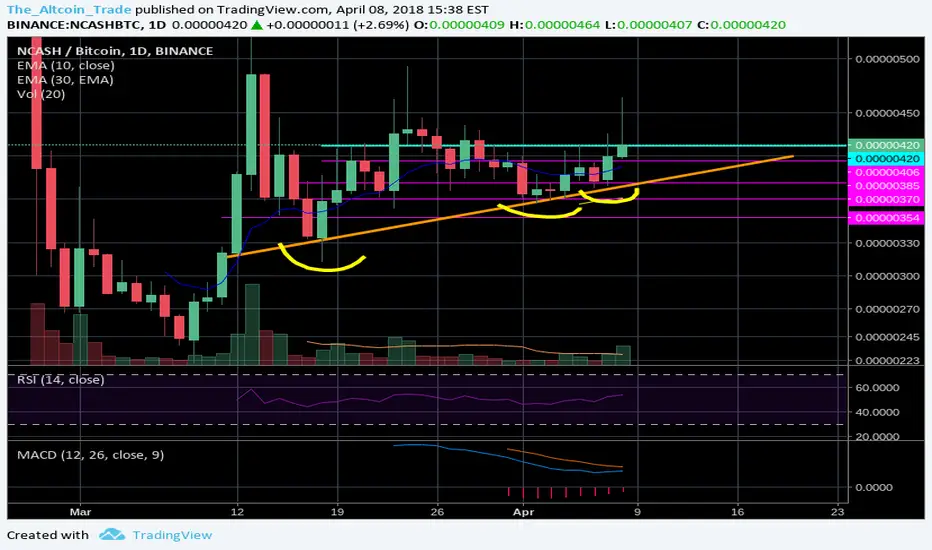
Daily Chart looks to be tightening up.
420 sats is that former resistance/now support level where the price keeps dropping to after pushing past it a few weeks ago.
That being said, higher low's are being formed. I expect a move within the next week to the upside.
420 sats is that former resistance/now support level where the price keeps dropping to after pushing past it a few weeks ago.
That being said, higher low's are being formed. I expect a move within the next week to the upside.
ملاحظة
The 4hr Chart has the candle bouncing off of the 30 EMA. Keep eyes on the volume.إخلاء المسؤولية
لا يُقصد بالمعلومات والمنشورات أن تكون، أو تشكل، أي نصيحة مالية أو استثمارية أو تجارية أو أنواع أخرى من النصائح أو التوصيات المقدمة أو المعتمدة من TradingView. اقرأ المزيد في شروط الاستخدام.
إخلاء المسؤولية
لا يُقصد بالمعلومات والمنشورات أن تكون، أو تشكل، أي نصيحة مالية أو استثمارية أو تجارية أو أنواع أخرى من النصائح أو التوصيات المقدمة أو المعتمدة من TradingView. اقرأ المزيد في شروط الاستخدام.