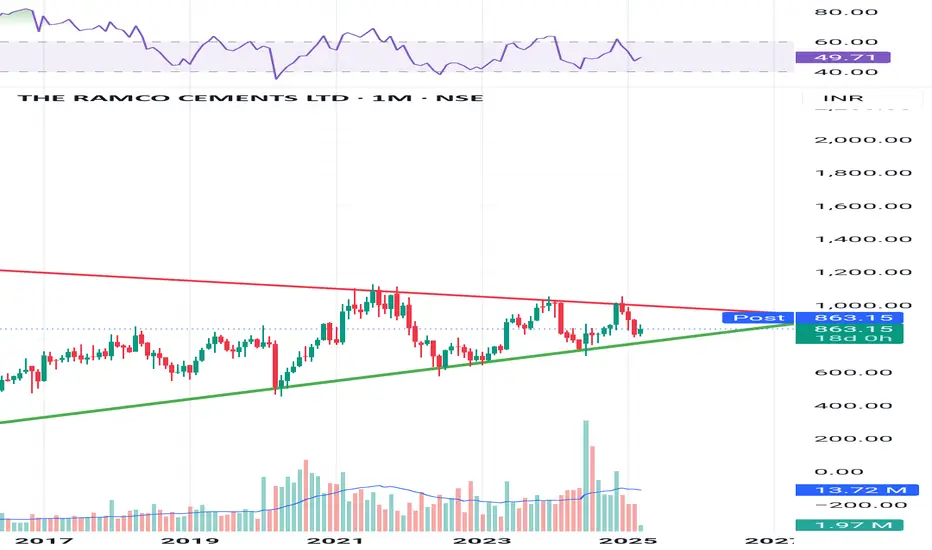
This chart shows The Ramco Cements Ltd on a monthly timeframe, with price action forming a clear structure.
Analysis:
Pattern: A symmetrical triangle pattern, where the price is trading within a narrowing range.
Resistance (Red Line): Around ₹1000, where the price has faced multiple rejections.
Support (Green Line): Higher lows, indicating that the long-term uptrend is still intact.
RSI: Currently around 49.71, sitting in a neutral zone — neither overbought nor oversold.
Deception Point:
If the price breaks below ₹800 and sustains, it could signal a bearish breakdown.
Conversely, a breakout above ₹1000 with volume confirmation could trigger a strong bullish rally.
Next Steps:
Wait for a breakout with volume to confirm the move.
Enter the trade only after a confirmation candle to avoid getting trapped in a false breakout.
إخلاء المسؤولية
لا يُقصد بالمعلومات والمنشورات أن تكون، أو تشكل، أي نصيحة مالية أو استثمارية أو تجارية أو أنواع أخرى من النصائح أو التوصيات المقدمة أو المعتمدة من TradingView. اقرأ المزيد في شروط الاستخدام.
إخلاء المسؤولية
لا يُقصد بالمعلومات والمنشورات أن تكون، أو تشكل، أي نصيحة مالية أو استثمارية أو تجارية أو أنواع أخرى من النصائح أو التوصيات المقدمة أو المعتمدة من TradingView. اقرأ المزيد في شروط الاستخدام.