Price Action :
Bollinger Bands :
Volume :
Key Support and Resistance :
Trend :
Conclusion :
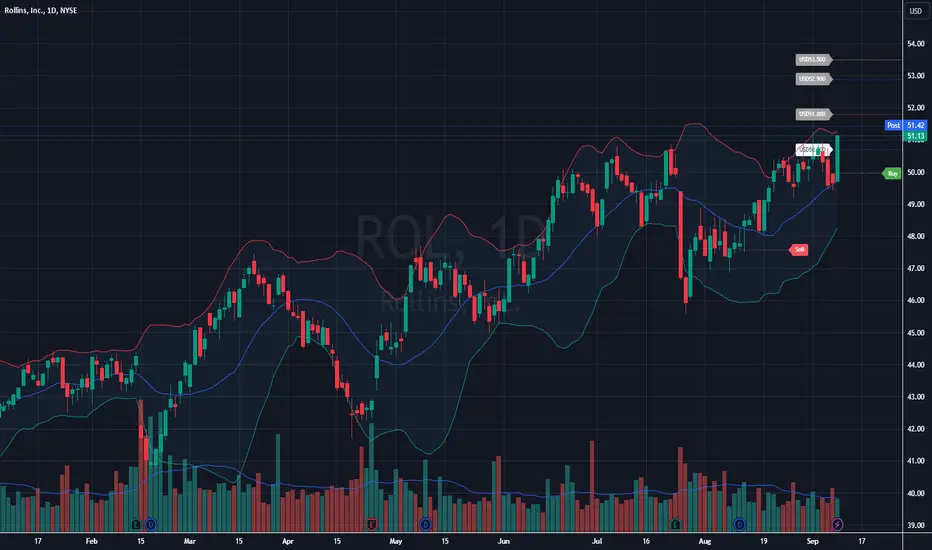
- The price recently bounced off the lower Bollinger Band, suggesting it may have found support near $49.00.
Bollinger Bands :
- The price is moving towards the upper Bollinger Band, indicating bullish momentum.
Volume :
- There has been a slight increase in volume accompanying the recent price rise, which can be a bullish sign of commitment from buyers.
Key Support and Resistance :
- Support: Around $49.00 (recent low and moving average level).
- Resistance: $52.00, which acted as a resistance level previously. A break above this level could trigger a further rally.
Trend :
- The short-term trend is bullish, as the price is climbing steadily towards the previous highs.
Conclusion :
- The stock is showing strength as it approaches a key resistance at $52.00. A breakout with volume would be a bullish signal for further upside. However, if it fails to break this level, there could be a pullback towards the $49.00 support level.
➀➁➂➃➄
إخلاء المسؤولية
لا يُقصد بالمعلومات والمنشورات أن تكون، أو تشكل، أي نصيحة مالية أو استثمارية أو تجارية أو أنواع أخرى من النصائح أو التوصيات المقدمة أو المعتمدة من TradingView. اقرأ المزيد في شروط الاستخدام.
➀➁➂➃➄
إخلاء المسؤولية
لا يُقصد بالمعلومات والمنشورات أن تكون، أو تشكل، أي نصيحة مالية أو استثمارية أو تجارية أو أنواع أخرى من النصائح أو التوصيات المقدمة أو المعتمدة من TradingView. اقرأ المزيد في شروط الاستخدام.