Introduction & Thesis
Tesla ( TSLA) is currently presenting a textbook technical setup on the daily chart. After a strong uptrend from May to October, the price has pulled back to a critical zone that previously acted as heavy resistance in early 2025. This analysis explains why this level is a crucial 'make-or-break' point for the bulls.
The Breakout and The Retest
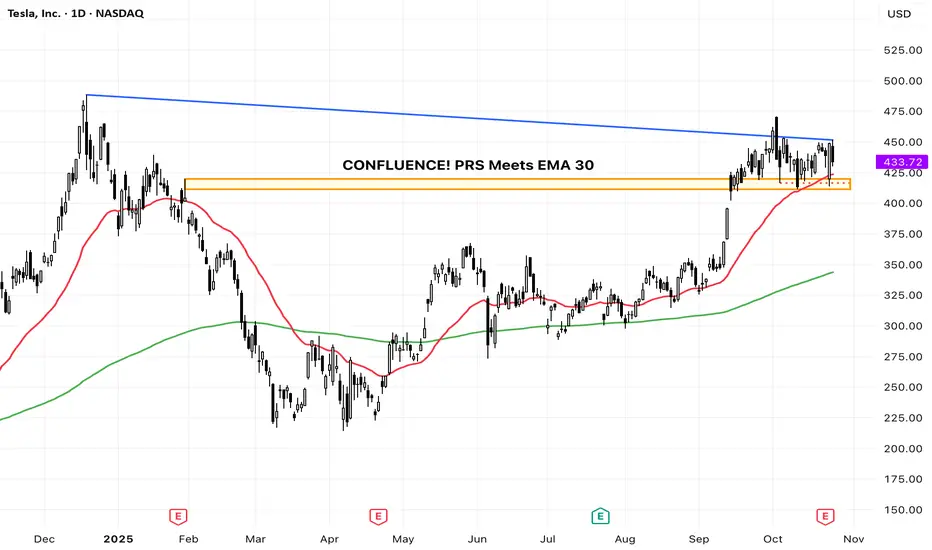
Observe the orange rectangle (approx. $410 - $425). This region was a significant ceiling for the price action earlier this year. According to technical theory, once a strong resistance level is decisively broken (which occurred in September), it is expected to flip its role and become a crucial support level. This is often referred to as a Prior Resistance Turned Support (PRS) area.
The price is currently pulling back right into this PRS zone, a common and healthy movement known as a retest.
Confluence of Support
Crucially, the 30-day Exponential Moving Average (EMA 30), which defines the short-term trend, is also converging with this key support zone. This creates a powerful confluence of support, significantly increasing the probability of a bounce. The long-term trend, indicated by the upward-sloping 200-day EMA (green line), remains firmly bullish, supporting the overall upward bias.
Scenarios
🎯 Bullish Scenario (The Bounce)
If the $410 - $425 zone holds and we see a strong bullish rejection candle (e.g., a hammer or engulfing pattern), it would confirm the support flip, suggesting the next leg of the rally towards the recent highs around $475.
🛑 Bearish Scenario / Invalidation (The Failure)
Conversely, a sustained daily close below $410 would be a crucial failure signal. This would invalidate the bullish retest thesis and suggest a deeper correction is underway, likely targeting the next major support zone around the 200-day EMA (currently near the $343 region).
📚 Educational Takeaway
This setup perfectly illustrates how traders look for confluence. The strongest support zones are those where multiple technical factors—like a former resistance level (PRS) and a strong moving average (EMA 30)—converge. A successful bounce here reinforces the power of market structure principles.
(Disclaimer: This is for educational purposes only and not financial advice.)
Tesla (
The Breakout and The Retest
Observe the orange rectangle (approx. $410 - $425). This region was a significant ceiling for the price action earlier this year. According to technical theory, once a strong resistance level is decisively broken (which occurred in September), it is expected to flip its role and become a crucial support level. This is often referred to as a Prior Resistance Turned Support (PRS) area.
The price is currently pulling back right into this PRS zone, a common and healthy movement known as a retest.
Confluence of Support
Crucially, the 30-day Exponential Moving Average (EMA 30), which defines the short-term trend, is also converging with this key support zone. This creates a powerful confluence of support, significantly increasing the probability of a bounce. The long-term trend, indicated by the upward-sloping 200-day EMA (green line), remains firmly bullish, supporting the overall upward bias.
Scenarios
🎯 Bullish Scenario (The Bounce)
If the $410 - $425 zone holds and we see a strong bullish rejection candle (e.g., a hammer or engulfing pattern), it would confirm the support flip, suggesting the next leg of the rally towards the recent highs around $475.
🛑 Bearish Scenario / Invalidation (The Failure)
Conversely, a sustained daily close below $410 would be a crucial failure signal. This would invalidate the bullish retest thesis and suggest a deeper correction is underway, likely targeting the next major support zone around the 200-day EMA (currently near the $343 region).
📚 Educational Takeaway
This setup perfectly illustrates how traders look for confluence. The strongest support zones are those where multiple technical factors—like a former resistance level (PRS) and a strong moving average (EMA 30)—converge. A successful bounce here reinforces the power of market structure principles.
(Disclaimer: This is for educational purposes only and not financial advice.)
I follow price, not predictions.
Trends speak louder than opinions.
Follow me to stay updated with my latest trade setups.
Trends speak louder than opinions.
Follow me to stay updated with my latest trade setups.
إخلاء المسؤولية
لا يُقصد بالمعلومات والمنشورات أن تكون، أو تشكل، أي نصيحة مالية أو استثمارية أو تجارية أو أنواع أخرى من النصائح أو التوصيات المقدمة أو المعتمدة من TradingView. اقرأ المزيد في شروط الاستخدام.