UI elements
The library offers a feature-rich interface, providing the opportunity to tweak and customize it to fit specific needs. This article serves as a guide to understanding the various parts of the interface. Further articles within this section provide detailed explanations for each UI element.
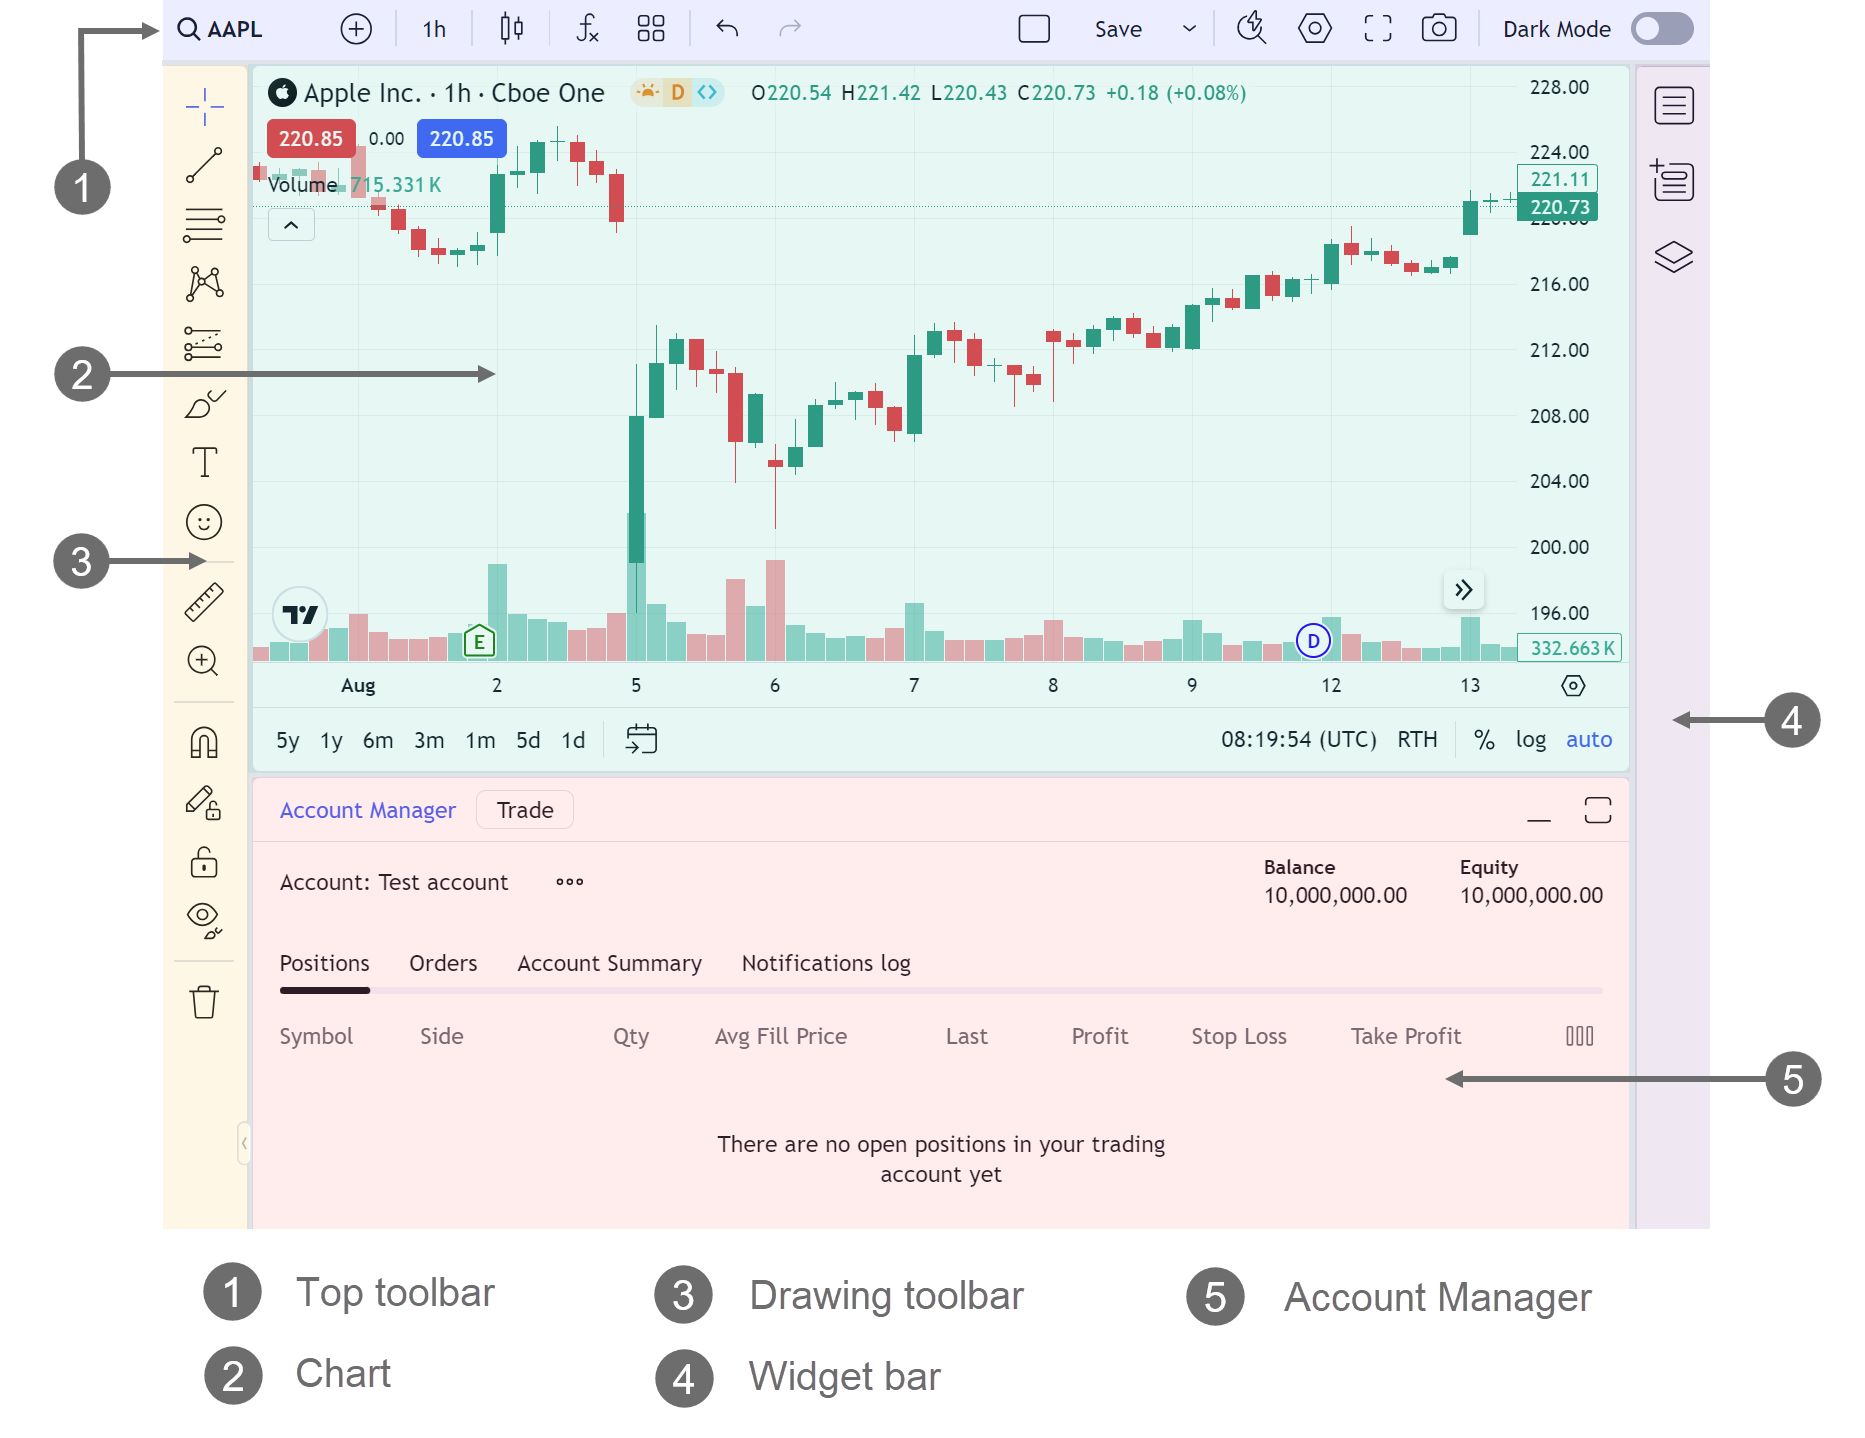
The interface can be divided into the following main parts.

Top toolbar
Symbol Search
Customize the button that allows searching for and displaying financial instruments by entering instrument names
Resolution
Manage the timeframe resolutions that define the duration of each bar
Chart styles
Adjust properties for various chart styles to enhance the appearance of your main series
Indicators
Customize built-in indicators and create your own using JavaScript
Save layouts and templates
Allow users to save and restore chart layouts and chart, drawing, and indicator templates for future use
Snapshots
Configure the settings for taking snapshots and managing their storage
Custom buttons
Add custom buttons or drop-down menus to the top toolbar for quick access to specific functions
Multiple-chart layout
Allow users to display up to 8 charts on one layout (Trading Platform only)
Chart
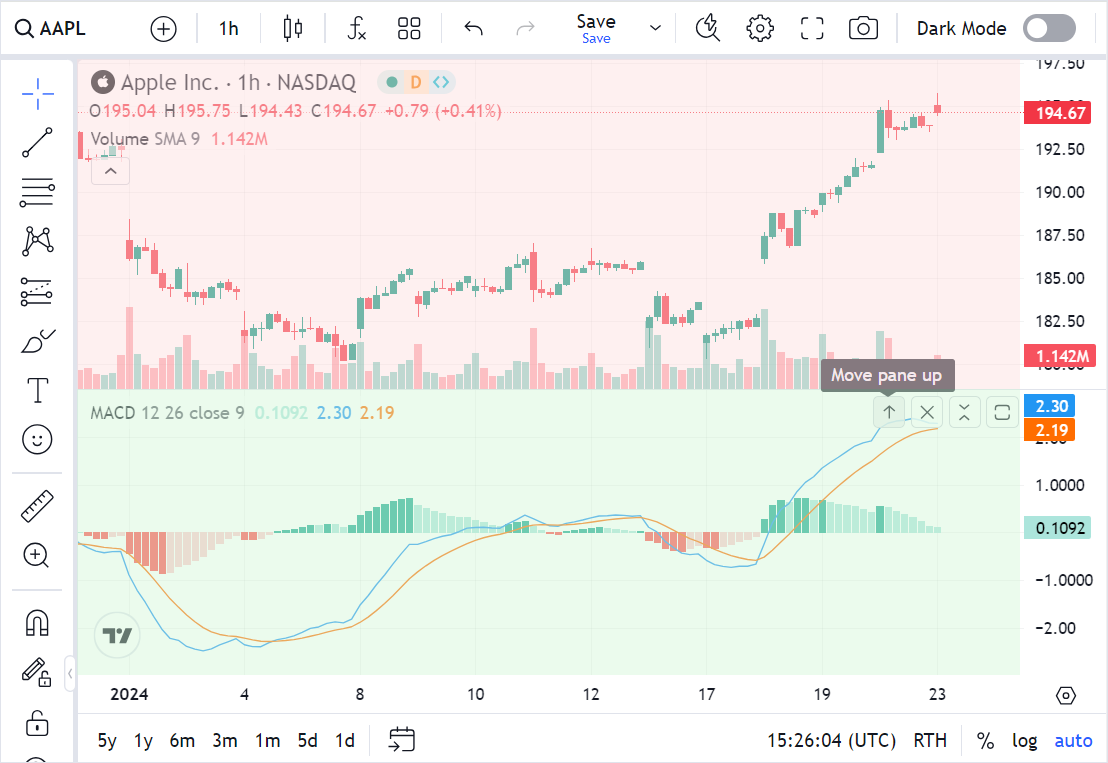
The main area on the chart where a series or indicator is displayed is called pane. The picture below shows the red pane with a main series and the green pane with an indicator.

The chart contains the following elements:
Chart
Customize colors and learn how to use the Chart API to subscribe to events, manage drawings, and more
Price scale
Customize the price scale appearance and manage it through the API
Time scale
Customize the time scale appearance and manage it through the API
Legend
Customize the legend appearance: include symbol logos, set titles, and format prices according to your preferences
Marks
Display additional information such as news, bar patterns, splits, and dividends on the chart or time scale
Market status
Provide users with updates on whether the market is open or closed for trading
Context menu
Customize the dialog accessed through a right-click or ellipsis menu
Time zones
Configure time zones to suit your application’s needs
Drawing toolbar
Drawings are the tools that can help you analyze the charts and make clear annotations to them. For more information, refer to Drawings.
Widget bar
The widget bar is a right side toolbar available in Trading Platform only.
You cannot change the widget bar location but you can hide it using the hide_right_toolbar and hide_right_toolbar_tabs featuresets.
The bar displays the following widgets:
Object Tree
Allow users to manage drawings, indicators, and symbols on the chart
Watchlist
Allow users to track real-time price movements and volume of selected financial instruments
Details
Display detailed information for a specific symbol, including bid/ask prices, trading hours, and daily price ranges
News
Display latest news related to specific symbols
Account Manager
The Account Manager is a widget available in Trading Platform only. The widget displays the user's trading information, such as orders, positions, and account balance. Users can manage their orders and positions from the Account Manager. For more information, refer to Account Manager.