PROTECTED SOURCE SCRIPT
تم تحديثه Session Volume Profile – Asia • London • NY - GammaBulldog
Session Volume Profile – Asia • London • NY PRO - Gamma Bulldog
Description:
This Session Volume Profile (SVP) tool displays intraday volume distribution for the Asian, London, and New York sessions. It helps you quickly identify Price of Control (POC) and Value Area High/Low (VAH/VAL) levels for each session.
How to Read It:
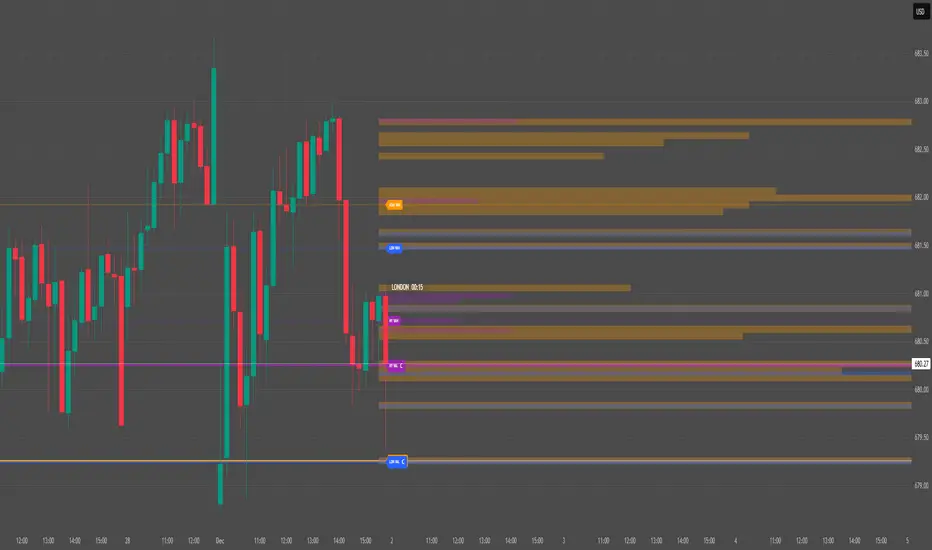
Colored Levels:
Orange: Asian session POC and VAH/VAL
Blue: London session POC and VAH/VAL
Purple: New York session POC and VAH/VAL
Solid Lines:
POC (thick line): The price level with the highest traded volume for the session.
VAH/VAL (dotted lines): Upper and lower bounds of the value area, representing ~70% of traded volume by default.
Volume Histogram:
Bars indicate where most volume occurred within each session. Longer bars = higher traded volume.
Reading the Chart:
Price near POC suggests a session-level balance point.
Price approaching VAH may encounter resistance; approaching VAL may find support.
Compare sessions to see how liquidity shifts across time zones, helping identify potential intraday trends or reversals.
Customization Options:
Adjust rows and value area % for finer detail.
Toggle visibility of any session.
Adjust fill opacity for clarity on your chart.
Notes:
This is an analysis tool only, not a signal or financial advice.
Designed for 15-min to 1-hour charts for optimal intraday clarity.
Description:
This Session Volume Profile (SVP) tool displays intraday volume distribution for the Asian, London, and New York sessions. It helps you quickly identify Price of Control (POC) and Value Area High/Low (VAH/VAL) levels for each session.
How to Read It:
Colored Levels:
Orange: Asian session POC and VAH/VAL
Blue: London session POC and VAH/VAL
Purple: New York session POC and VAH/VAL
Solid Lines:
POC (thick line): The price level with the highest traded volume for the session.
VAH/VAL (dotted lines): Upper and lower bounds of the value area, representing ~70% of traded volume by default.
Volume Histogram:
Bars indicate where most volume occurred within each session. Longer bars = higher traded volume.
Reading the Chart:
Price near POC suggests a session-level balance point.
Price approaching VAH may encounter resistance; approaching VAL may find support.
Compare sessions to see how liquidity shifts across time zones, helping identify potential intraday trends or reversals.
Customization Options:
Adjust rows and value area % for finer detail.
Toggle visibility of any session.
Adjust fill opacity for clarity on your chart.
Notes:
This is an analysis tool only, not a signal or financial advice.
Designed for 15-min to 1-hour charts for optimal intraday clarity.
ملاحظات الأخبار
Added Kill Zones (red background)Added Live Session Countdown
Top-left timer counting down current session (LONDON 06:30, etc.)
نص برمجي محمي
تم نشر هذا النص البرمجي كمصدر مغلق. ومع ذلك، يمكنك استخدامه بحرية ودون أي قيود - تعرف على المزيد هنا.
إخلاء المسؤولية
لا يُقصد بالمعلومات والمنشورات أن تكون، أو تشكل، أي نصيحة مالية أو استثمارية أو تجارية أو أنواع أخرى من النصائح أو التوصيات المقدمة أو المعتمدة من TradingView. اقرأ المزيد في شروط الاستخدام.