PROTECTED SOURCE SCRIPT
ADR Bottom-Right TABLE Dashboard
Title: ADR Bottom-Right Dashboard
Version: 1.0
Author: [Your Name]
Description:
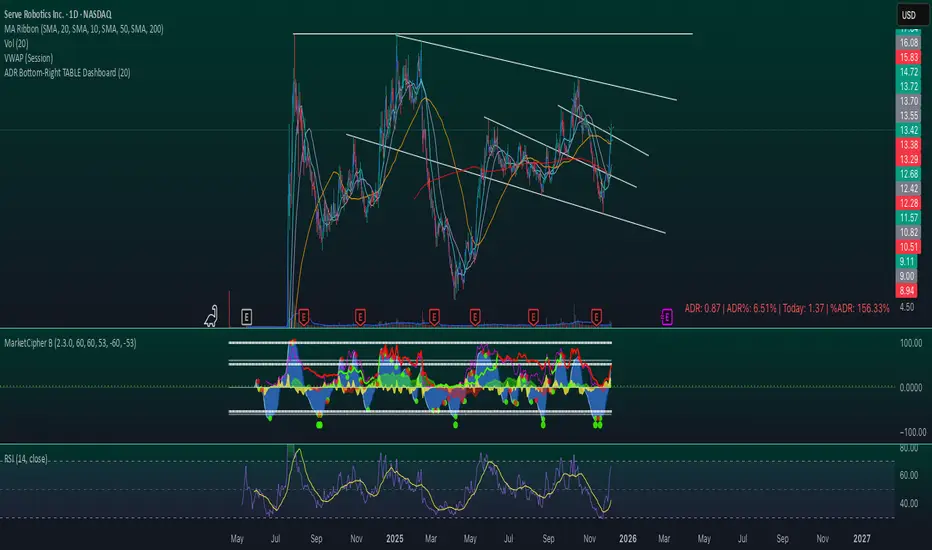
The ADR Bottom-Right Dashboard displays the Average Daily Range (ADR) and related metrics directly on your chart in a compact, easy-to-read table. It helps traders quickly see how much a stock has moved today relative to its normal daily range and identify potential overextended or trending moves.
This tool is ideal for swing traders, day traders, and scalpers who want a real-time, visual indication of volatility and intraday movement.
Features
ADR (Average Daily Range): Shows the average high-to-low movement over a customizable period (default 20 days).
ADR%: ADR as a percentage of the stock price, showing relative volatility.
Today: The current intraday range (high–low).
%ADR: How much of the ADR has already been reached today. Color-coded to indicate low, medium, or high extension.
Color coding: %ADR highlights:
Green: <50% (early-day / low volatility)
Yellow: 50–100% (normal movement)
Red: >100% (extended move / potential exhaustion)
Inputs
Input Description Default
ADR Period Number of days to calculate the ADR 20
Low %ADR Color Color for %ADR <50% Green
Medium %ADR Color Color for %ADR 50–100% Yellow
High %ADR Color Color for %ADR >100% Red
Version: 1.0
Author: [Your Name]
Description:
The ADR Bottom-Right Dashboard displays the Average Daily Range (ADR) and related metrics directly on your chart in a compact, easy-to-read table. It helps traders quickly see how much a stock has moved today relative to its normal daily range and identify potential overextended or trending moves.
This tool is ideal for swing traders, day traders, and scalpers who want a real-time, visual indication of volatility and intraday movement.
Features
ADR (Average Daily Range): Shows the average high-to-low movement over a customizable period (default 20 days).
ADR%: ADR as a percentage of the stock price, showing relative volatility.
Today: The current intraday range (high–low).
%ADR: How much of the ADR has already been reached today. Color-coded to indicate low, medium, or high extension.
Color coding: %ADR highlights:
Green: <50% (early-day / low volatility)
Yellow: 50–100% (normal movement)
Red: >100% (extended move / potential exhaustion)
Inputs
Input Description Default
ADR Period Number of days to calculate the ADR 20
Low %ADR Color Color for %ADR <50% Green
Medium %ADR Color Color for %ADR 50–100% Yellow
High %ADR Color Color for %ADR >100% Red
نص برمجي محمي
تم نشر هذا النص البرمجي كمصدر مغلق. ومع ذلك، يمكنك استخدامه بحرية ودون أي قيود - تعرف على المزيد هنا.
إخلاء المسؤولية
لا يُقصد بالمعلومات والمنشورات أن تكون، أو تشكل، أي نصيحة مالية أو استثمارية أو تجارية أو أنواع أخرى من النصائح أو التوصيات المقدمة أو المعتمدة من TradingView. اقرأ المزيد في شروط الاستخدام.