المؤشرات والاستراتيجيات والمكتبات
Use this indicator on Daily Timeframe Please refer to the below link for CFTC Disaggregated COT www.cftc.gov This script is very similar to COT Financial Plot indicator except that it plots the data for Disaggregated Futures
A simple script to draw a realized volatility forecast, in the form of a box. The script calculates realized volatility using the EWMA method, using a number of periods of your choosing. Using the "periods per year", you can adjust the script to work on any time frame. For example, if you are using an hourly chart with bitcoin, there are 24 periods * 365 = 8760...
This script provides realized volatility (rv), implied volatility (iv), and volatility risk premium (vrp) information for each of CBOE's volatility indices. The individual outputs are: - Blue/red line: the realized volatility. This is an annualized, 20-period moving average estimate of realized volatility--in other words, the variability in the instrument's...
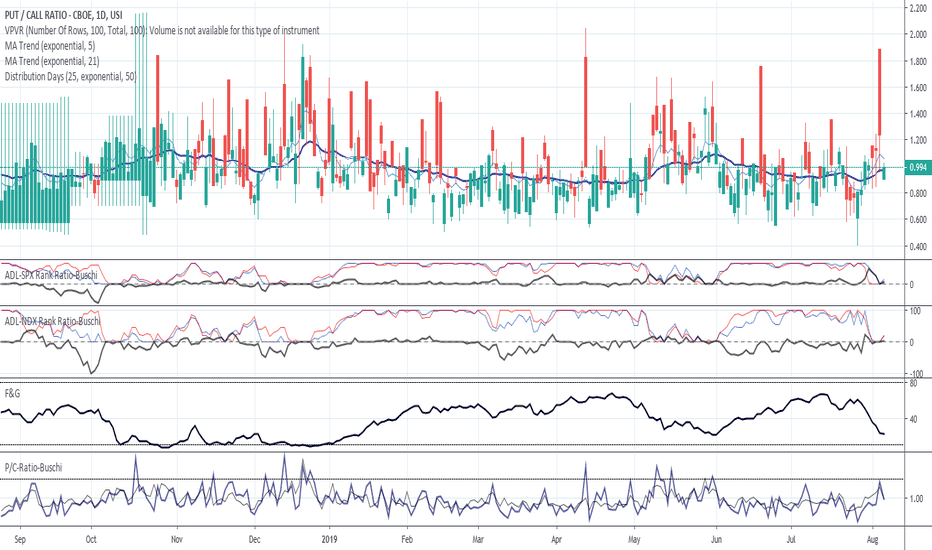
First of all this script inspired by MagicEins' Put/Call-Ratio-Buschi script . What is the Put-Call Ratio The put-call ratio is an indicator ratio that provides information about relative trading volumes of an underlying security's put options to its call options. The put-call ratio has long been viewed as an indicator of investor sentiment in the markets, where...
This script is the my Dependent Variable Odd Generator script : with the Put / Call Ratio ( PCR ) appended, only for CBOE and the instruments connected to it. For CBOE this script is more accurate and faster than Dependent Variable Odd Generator. And the stagnant market odds are better and more realistic. Do not use for timeframe periods less than 1 day. Because...
English: This script shows the Put/Call-Ratio as seen on the Cboe-Website: www.cboe.com A higher Put/Call-Ratio means a higher trading volume of puts compared to calls, which is a sign of a higher need for protection in the market. For best reflection of the Cboe's data, which is shown in 30 minutes intervals, a 30 min-chart is recommended. 30 min-data as...
how to pull data from quandl.com this script for CBOE/CME BTC FUTURE ex. if you want to pull www.quandl.com you input "QUANDL:CFTC/1330E1_FO_ALL|n" as TV symbol.("n" is table number)
This script compares the implied volatility to the historic volatility as a ratio. The plot indicates how high the current implied volatility for the next 30 days is relative to the actual volatility realized over the set period. This is most useful for options traders as it may show when the premiums paid on options are over valued relative to the historic...
just update the settlement date.
Version 0.9 beta: - Takes heavy performance showing history expiry dates


![IV/HV ratio 1.0 [dime] SPX: IV/HV ratio 1.0 [dime]](https://s3.tradingview.com/j/jAwpo36h_mid.png)


