المؤشرات والاستراتيجيات والمكتبات
█ Introduction and How it is Different The "Stablecoin Supply - Indicator" differentiates itself by focusing on the aggregate supply of major stablecoins—USDT, USDC, and DAI—rather than traditional price-based metrics. Its premise is that fluctuations in the total supply of these stablecoins can serve as leading indicators for broader market movements, offering...
STABLECOINS DEPEG FINDER With this script, you will be able to understand how DePeg in stablecoins USDT, USDC, and FDUSD can influence the TOTAL Market Cap. WHAT IS DEPEG? DePeg occurs when a stablecoin loses its peg. It can't maintain the $1.00 price for a while (or anymore). Traders can use DePeg for high-quality trading both in Crypto and Stablecoins....
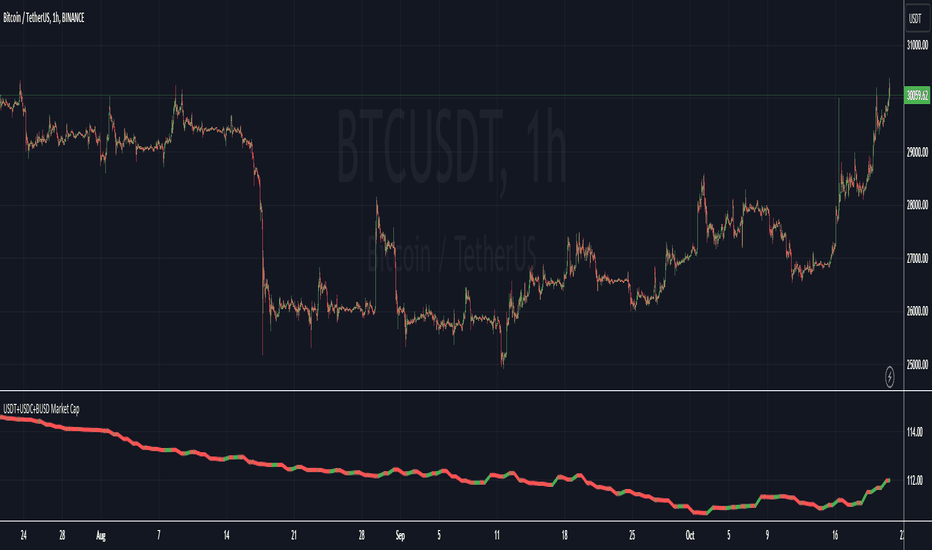
This Pine Script indicator visualizes the combined market capitalization of three prominent stablecoins: USDT, USDC, and BUSD, on a daily basis. It fetches the daily closing market caps of these stablecoins and sums them. The resulting line graph is displayed in its own separate pane below the main price chart. The line is color-coded: green on days when the...
A simple indicator that displays either the aggregated market cap of the top five stablecoins, or it displays all coins at once (look in the settings). Because of limitations with the sourced data the indicator only works on the daily timeframe or higher.
Dear Tradingview community, I'd like to share one of my staple indicators with you. The volatility depth indicator calculates the volatility over a 7-day period and plots it on your chart. This indicator only works for the DAILY chart on BTC/USD. Colors I've color coded the indicator as follows: - Red: Extreme Volatility - Orange: High Volatility - Yellow:...
USDT INFLOW TRACKER What does this script do? It looks for important inflow from USDT and write it below or above your chart. Does it matter? Yes because Tether with planned USDT inflow highly manipulate the crypto market. With this simple script you can study what and when something strange is going to happen on your favourite token. HOW IT WORKS? Pretty...
Stablecoins Dominance The purpose of the script is to show Stablecoin's strength in the crypto markets. 5 Largest Stablecoins divided by Total Market Cap
🔰Overview Charts are an essential part of working with data, as they are a way to condense large amounts of data into an easy to understand format. Visualizations of data can bring out insights to someone looking at the data for the first time, as well as convey findings to others who won’t see the raw data. There are countless chart types out there, each with...
USDT dominance charts are rare to find as almost everyone is fixated on BTC dominance. Bitcoin dominance gives us insight into investors' preferences when they have a choice between BTC and thousands of altcoins. This oscillator gives insight into the state of the coin market. When people exchange their digital currencies like BTC and Altcoins for USDT, there is...
Kraken + FTX USDT premium indicator. Inspired by John J Brown, forked from IAmSatoshi (Migrated to V5 and few changes + more markets coming). John J Brown: " USDt premium/discount exist because of conversion fees. It is a good market indicator: If USDt>USD, then market is growing and in need of liquidity; If USDt<USD, then market is shrinking and has excess liquidity."
Use Crypto Open Interest Data available on TradingView to your advantage. Features Auto-Detect Symbol (based on chart) Preset Symbols (BTC, ETH, BNB, XRP, LUNA, ADA, SOL, AVAX and DOT) Exchanges ( Binance and BitMex ) Inverse and USDT Pairs Override Data Option to use any OI Data on TradingView Customizable Candles
Shows Open Interest of ANY Binance pair (BTCUSD, ETHUSD, ADAUSD, ...). Inverse and USDT pairs Preset-Pairs (BTC, ETH, XRP, ADA, SOL, DOT, ...) Custom Candle Colors (candles can be turned off)
Simple way how to use Linear Regression for trading. What we use: • Linear Regression • EMA 200 as a trend filter Logic: Firstly we make two different linear regression movings as oscillator. For this we need to subtract slow moving from fast moving, so we get the single moving around zero. This is the green/red line which appears on the chart. The trade open...
The Stablecoin Supply Ratio (SSR) is the ratio between Bitcoin supply and the supply of stablecoins, denominated in BTC. When the SSR is low, the current stablecoin supply has more "buying power" to purchase BTC. It serves as a proxy for the supply/demand mechanics between BTC and USD.
That is quit simple strategy, which combines only two indicators: AO and MA. The logic of trades is also clear, when AO is bullish; slow ma is under the close price; fast ma > slow ma - buy.
This is a full crypto swing strategy designed. From my testing it looks like it perform the best on timeframes 4h +. The below example has been adapted to BNB/USDT, using the entire period since 2017 until present day, with a comission of 0.03% ( which is the comission for the futures on binance). Its components are : ALMA Fast ALMA Slow MACD Histogram Rules...
This is a simple long only strategy made of Aroon and Least Square moving average. The rules are simple: Long entry = crossover of upper part with the lower part from aroon and close of the candle is above the moving average Long exit = crossunder of upper part with the lower part from aroon and close of the candle is below the moving average IF you have any...
CONCEPT A toolkit with a bunch of different metrics for the widely used stablecoin called tether (USDT). It's very easy to use, just select in the settings what data you want to look at. FEATURES Value index. The "index" setting shows a volume weighted index of different exchanges to give the most accurate average USDT/USD price. Market cap. ...
![Crypto Stablecoin Supply - Indicator [presentTrading] BTCUSD: Crypto Stablecoin Supply - Indicator [presentTrading]](https://s3.tradingview.com/j/J6yl9jUr_mid.png)


