To Pine Script® version 6
Introduction
Pine Script v6 introduces a number of changes and new features. See the Release Notes for a list of all new features.
Some changes are not compatible with v5 scripts. This guide explains how to update your script from v5 to v6. If you want to convert a script from v4 or earlier to v6, refer to the migration guides for previous versions and update the script one version at a time.
The Pine Editor converter can handle many of these changes automatically, while other changes might require manual fixes.
Here are the changes that affect v5 scripts:
- Values of the “int” and “float” types are no longer implicitly cast to “bool”.
- Boolean values can no longer be na, and the na(), nz(), and fixnan() functions no longer accept “bool” arguments.
- The and and or operators now evaluate conditions lazily.
- All
request.*()functions can now execute dynamically. - Division of two “const int” values can now return a fractional value.
- The
whenparameter is removed from all applicablestrategy.*()functions. - The default long and short margin percentage for strategies is now 100.
- Strategies now trim the oldest orders in their results instead of raising an error when they exceed the 9000 trade limit.
- The strategy.exit() command no longer ignores relative parameters defining take-profit and stop-loss prices or trailing stop activation levels when the call also includes arguments for the related absolute parameters.
- The history-referencing operator [] can no longer reference the history of literal values or fields of user-defined types directly.
- Function calls can no longer include more than one argument for the same parameter.
- The
offsetparameter of plot() and other functions no longer accepts “series” values. - na values are no longer allowed in place of built-in constants of unique types.
- The value of timeframe.period now always includes a multiplier (e.g.,
"1D"instead of"D"). - Some
array.*()functions now accept negative index arguments. - Some mutable variables are no longer erroneously marked as “const”.
- The
transpparameter is removed from all applicable functions. - Some default colors and color constants have updated values.
- The for loop statement now evaluates its end boundary dynamically before every iteration.
Converting v5 to v6 using the Pine Editor
The Pine Editor can automatically convert a v5 script to v6. The Pine Editor highlights the //@version=5 annotation of a v5 script in yellow.
To convert the script, click the editor’s “Manage script” dropdown menu and select “Convert code to v6”:
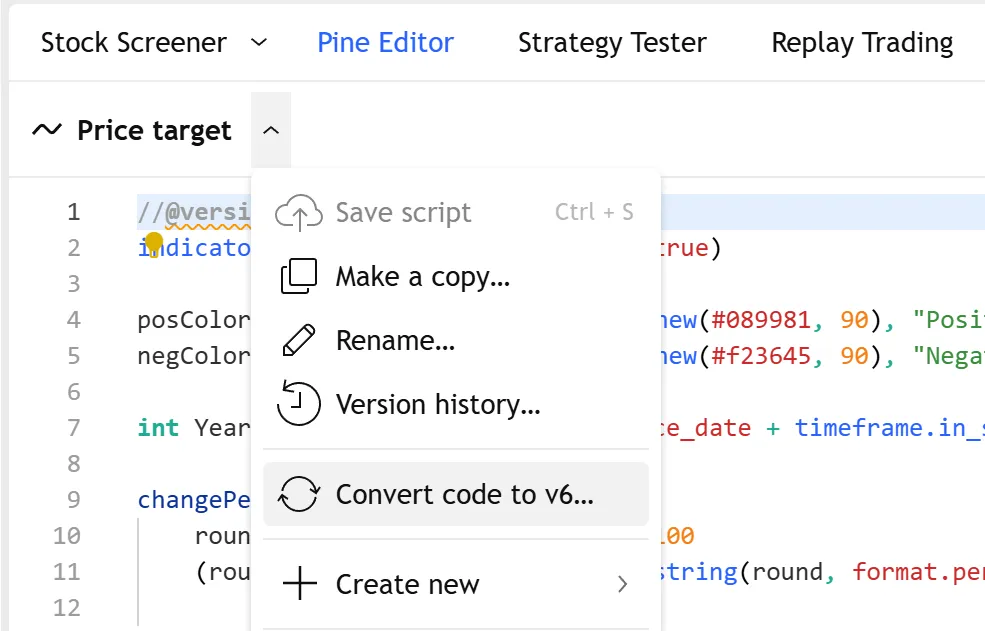
A script can be converted only if its v5 code compiles successfully. In rare cases, converting the script automatically can result in a v6 script with compilation errors. In that case, the errors are highlighted in the Editor, and you need to resolve them by using the information in the following sections.
Dynamic requests
In Pine v6, scripts can call all request.*() functions dynamically by default, allowing any single request.*() call instance in the code to request data from different datasets and work within local scopes.
When a script does not use dynamic requests, the context of a data request (ticker ID and timeframe) must be known on the first script execution and remain unchanged across all subsequent executions. Therefore, symbol, timeframe, and other parameters specifying a non-dynamic request.*() call’s context require arguments with the “simple” qualifier. Additionally, non-dynamic requests must execute globally, meaning they are not allowed inside the local scopes of loops and other structures.
In contrast, when a script allows dynamic requests, it can call request.*() functions with “series” arguments for the parameters that define the context of the data requests. With this qualifier change, scripts can:
- Retrieve data from new datasets on any historical bar, even after the first available bar, with a single
request.*()call instance. - Store symbol and timeframe strings in collections or objects, then use the collected values to define a
request.*()call’s context. - Call
request.*()functions within the local scopes of loops and conditional structures. - Export library functions containing
request.*()calls.
Non-dynamic requests are the default in Pine v5. Scripts coded in v5 can execute dynamic requests, but only if programmers specify dynamic_requests = true in the indicator(), strategy(), or library() declaration statement. If not specified, the default argument is false.
In Pine v6, dynamic requests are always available by default. When a script includes request.*() calls, the compiler analyzes the script to determine whether dynamic requests are necessary. If unnecessary for the script, the compiler automatically turns the feature off to optimize performance.
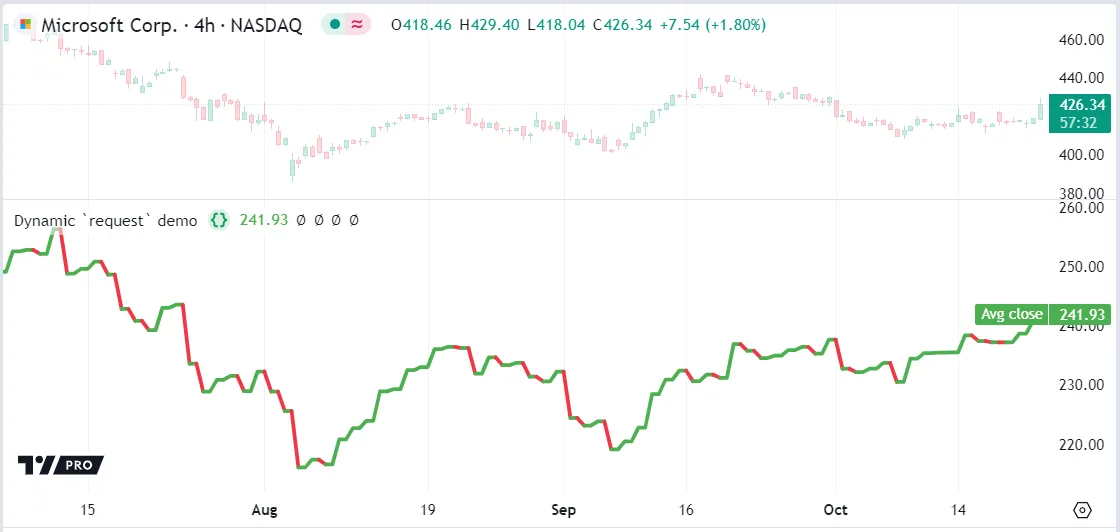
The following v6 example uses a single request.security() instance in a loop to retrieve data for multiple symbols stored in an array. On each iteration, the script dynamically retrieves the close price for one of the stored symbols from the “1D” timeframe and pushes the retrieved value into an array with array.push(). After the loop terminates, the script calculates that array’s average using array.avg() and plots the result. In Pine v5, this script would cause a compilation error unless we included dynamic_requests = true in the declaration statement:
There are minor differences between dynamic and non-dynamic requests in some obscure cases, such as when using the result of one request.security() call in the expression argument of another call. As a result, a valid v5 script without dynamic requests can behave differently after conversion to v6, even if nothing related to the requests was changed in the code.
Fix: In Pine v6, the dynamic_requests parameter of the indicator(), strategy(), and library() functions is true by default. If you find differences in a request.*() call’s behavior after converting a script to v6, you can include dynamic_requests = false in the declaration statement to force dynamic requests off and replicate most of the previous v5 behavior.
It’s important to note that, in Pine v5, it is possible to call user-defined functions or methods containing request.*() calls inside the local blocks of loops and conditional structures without enabling dynamic requests. However, such calls still require “simple” arguments for all parameters defining the requested context, which limits their utility.
In Pine v6, calling a request.*() function from the scope of a loop or conditional structure is not allowed if dynamic_requests is set to false in the script’s declaration statement, even if the call is within a user-defined function. A v6 script that attempts to use wrapped request.*() calls in local scopes without dynamic requests enabled causes a compilation error.
Fix: If a v5 script specifies dynamic_requests is false in its declaration statement and uses functions containing request.*() calls inside local blocks, remove the explicit dynamic_requests argument when converting the script to v6. The converted script will use dynamic requests automatically, allowing the functions containing request.*() calls to work correctly inside local scopes.
Types
The following changes have been made to how Pine handles types.
Explicit “bool” casting
In Pine v6, “int” and “float” values are no longer implicitly cast to “bool”.
In Pine v5, values of “int” and “float” types can be implicitly cast to “bool” when an expression or function requires a boolean value. In such cases, na, 0, or 0.0 are considered false, and any other value is considered true.
For example, take a look at this conditional expression:
It assigns color.red to expr on the first bar of the chart, because that bar has a bar_index of 0, and then assigns color.green on every following bar, because any non-zero value is true. The ternary operator ?: expects a “bool” expression for its condition, but in v5 it can also accept a numeric value as its conditional expression, which it automatically converts (implicitly casts) to a “bool”.
In v6, scripts must explicitly cast a numeric value to “bool” to use it where a “bool” type is required.
Fix: Wrap the numeric value with the bool() function to cast it explicitly.
Boolean values cannot be na
In v6, “bool” values can no longer be na. Consequently, the na(), nz(), and fixnan() functions no longer accept “bool” types.
In v5, “bool” variables have three possible values: they can be true, false, or na. The boolean na value behaves differently from both true and false:
-
When implicitly cast to “bool”,
nais evaluated asfalse. -
The boolean
navalue is not considered equal tofalsewhen compared using the==operator. -
When the boolean
navalue is passed to the na() function, it returnstrue, whereasna(true)andna(false)both returnfalse.
To manage the boolean na value, the na(), nz(), and fixnan() functions in v5 have overloads that accept “bool” type arguments. This third boolean state leads to occasional confusion in v5 scripts.
In v6, this is no longer the case: a “bool” must be either true or false, with no third state. This means that in v6 scripts:
-
A variable declared as “bool” can no longer be assigned
naas its default value. -
In conditional expressions like if and switch, if the return type of the expression is “bool”, any unspecified condition returns
falseinstead ofna. -
Expressions that returned a boolean
navalue in v5 now returnfalse. For example, using the history-referencing operator[]on the very first bar of the dataset to request a historical value of a “bool” variable returnednain v5, because no past bars exist, but in Pine v6 it returnsfalse. -
Functions that explicitly check whether a value is
na– specifically, na(), nz(), and fixnan() – do not accept “bool” arguments in v6.
This example v5 script creates a simple strategy that switches between long and short positions when two moving averages cross. An if-statement assigns true or false to a “bool” variable isLong to track the trade’s long or short direction, using the strategy’s positive (> 0) or negative (< 0) position size. However, when the position size is zero, neither of these conditions are valid. In v5, the undefined condition (== 0) assigns na to the variable isLong.
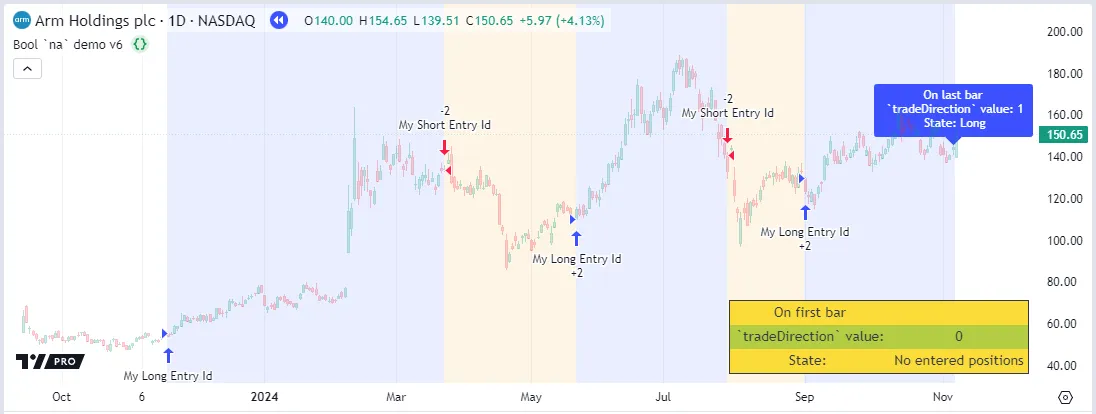
Therefore, a boolean na value occurs on the first few bars in the dataset before the strategy enters any positions. We can visualize the three “bool” states by setting the background color based on the value of isLong:
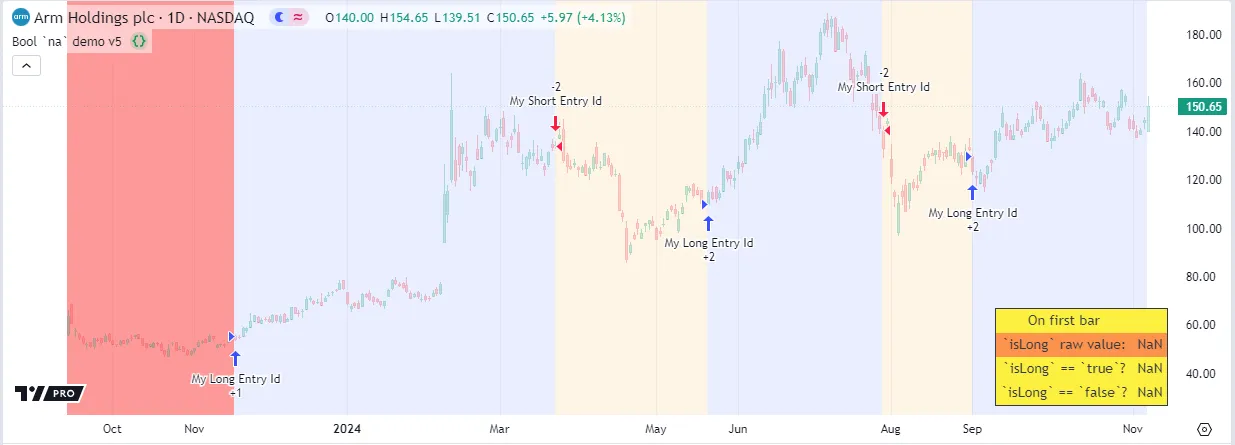
Fix: Remove any na(), nz(), and fixnan() functions that run on “bool” values. Ensure that all “bool” values are correctly interpreted as true or false states only. If your code logic requires a third na state to execute as intended, rewrite the code using a different type or structure to achieve the previous three-state behavior.
To adapt our code to Pine v6, we must first remove the following line to resolve the initial compilation error:
In v6, the undefined condition (strategy.position_size == 0) now returns false instead of na. Consequently, the script incorrectly highlights the bars where there are no trade positions the same color as those where there are short positions, since isLong has the same false result for both conditions:
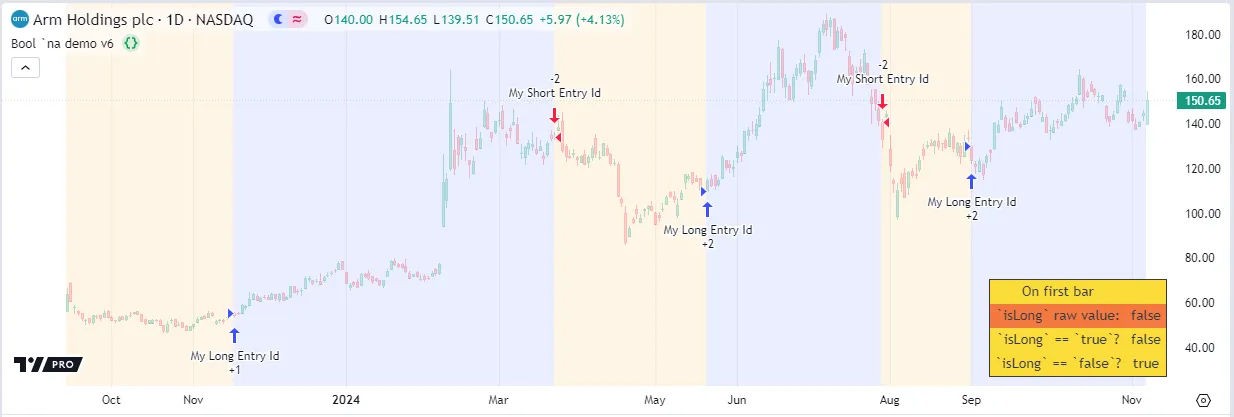
We want to distinguish between three unique states: long positions, short positions, and no entered positions. Therefore, using a two-state Boolean variable in v6 is no longer suitable. Instead, to maintain our desired behavior, we must rewrite the v6 code to replace the “bool” variable with a different type. For example, we can use an “int” variable to represent our three different position_size states using -1, 0, and 1:
Unique parameters cannot be na
Some Pine Script function parameters expect values of unique types. For example, the style parameter of the plot() function expects a value of the “input plot_style” qualified type, which must be one of the constants in the plot.style_* group.
In v5, passing na to the plot() function’s style parameter simply plots a line using the default style plot.style_line, without raising an error.
In v6, parameters that expect unique types no longer accept na values. Additionally, conditional expressions that return these unique types must be used in a form that cannot result in an na value. For example, a switch-statement must have a default block, and an if-statement must have an else-block, because these conditional expressions can return na otherwise.
The following example script shows two code structures that work in v5 but raise errors in v6.
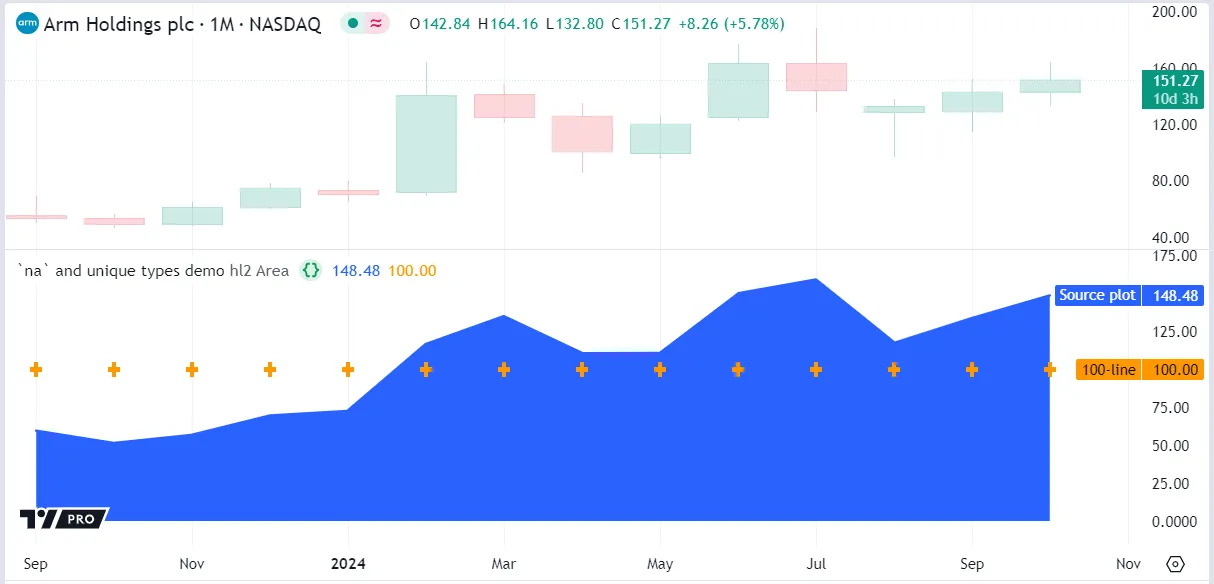
Fix: Ensure that no na value is passed to parameters that expect unique types, and that all conditional statements return a suitable non-na value.
Constants
The following changes have been made to how Pine handles constant values.
Fractional division of constants
Dividing two integer “const” values can return a fractional value.
In v5, the result of the division of two “int” values is inconsistent. If both values are qualified as “const”, the script performs what is known as integer division, and discards any fractional remainder in the result, e.g., 5/2 = 2. However, if at least one of the integers is qualified as “input”, “simple”, or “series”, the script preserves the fractional remainder in the division result: 5/2 = 2.5.

In v6, dividing two “int” values that are not evenly divisible always results in a number with a fractional value, regardless of the type and qualifier of the two arguments used. Therefore, the v6 division result is 5/2 = 2.5, even if both values involved are “const int”.

Fix: If you need an “int” division result without a fractional value, wrap the division with the int() function to cast the result to “int”, which discards the fractional remainder. Alternatively, use math.round(), math.floor(), or math.ceil() to round the division result in a specific direction.
Mutable variables are always “series”
In Pine v5, some mutable variables are qualified as “series” values but are erroneously qualified as “const”. This behavior is incorrect and allows a programmer to pass them where “series” variables are usually not accepted.
For example, the ta.ema() function expects its length argument to be an integer qualified as “simple” or weaker (see the Qualifiers hierarchy). In the example script below the seriesLen variable is effectively a “series” type because its value changes between bars. In v5, seriesLen can be passed to ta.ema(). Although this does not raise an error, it does not work as expected, because only its first recorded value 1 is used as the length in the script:
In v6, seriesLen is correctly parsed as a “series int” type, and raises a compilation error if passed in place of the expected “simple int” argument for length.
Fix: Pass values of the expected qualified type to built-in functions. In our example, set the length argument to a “const int” value.
Color changes
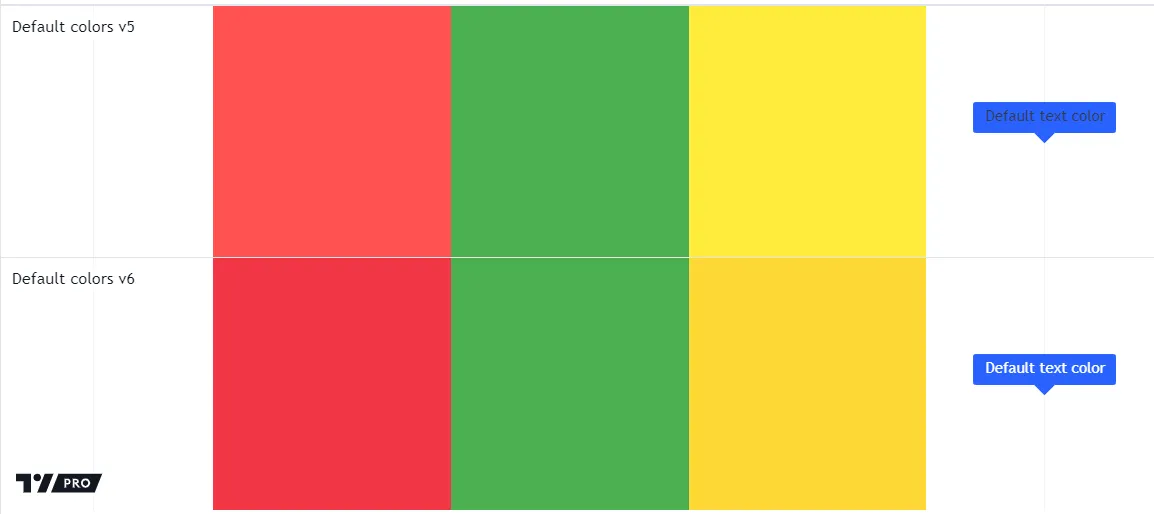
The color values behind some of the color.* constants have changed in Pine v6 to better reflect the TradingView palette:
| Constant name | Pine v5 color | Pine v6 color |
|---|---|---|
| color.red | #FF5252 | #F23645 |
| color.teal | #00897B | #089981 |
| color.yellow | #FFEB3B | #FDD835 |
Additionally, the default text color for label.new() is now color.white in v6 (previously color.black in v5) to ensure that the text is more visible against the default color.blue label.
Strategies
Removal of when parameter
The when parameter for order creation functions was deprecated in v5 and is removed in v6. An order is created only if the when condition is true, which is its default value. This parameter affects the following functions: strategy.entry(), strategy.order(), strategy.exit(), strategy.close(), strategy.close_all(), strategy.cancel(), and strategy.cancel_all().
The following example strategy shows the use of the when parameter, and works in v5 but not v6.
Fix: To trigger the order creation conditionally, use if statements instead.
Default margin percentage
The default margin percentage for strategies is now 100.
In v5, the default value of the margin_long and margin_short parameters is 0, which means that the strategy does not check its available funds before creating or managing orders. It can create orders that require more money than is available, and will not close short orders even when they lose more money than available to the strategy.
In Pine v6, the default margin percentage is 100. The strategy does not open entries that require more money than is available, and short orders are margin called if too much money is lost.
For example, we can see the difference in strategy behavior by running this simple strategy on the “ARM” symbol’s 4h chart using the v5 and v6 default margin values. When using Pine v5, there are no margin calls:
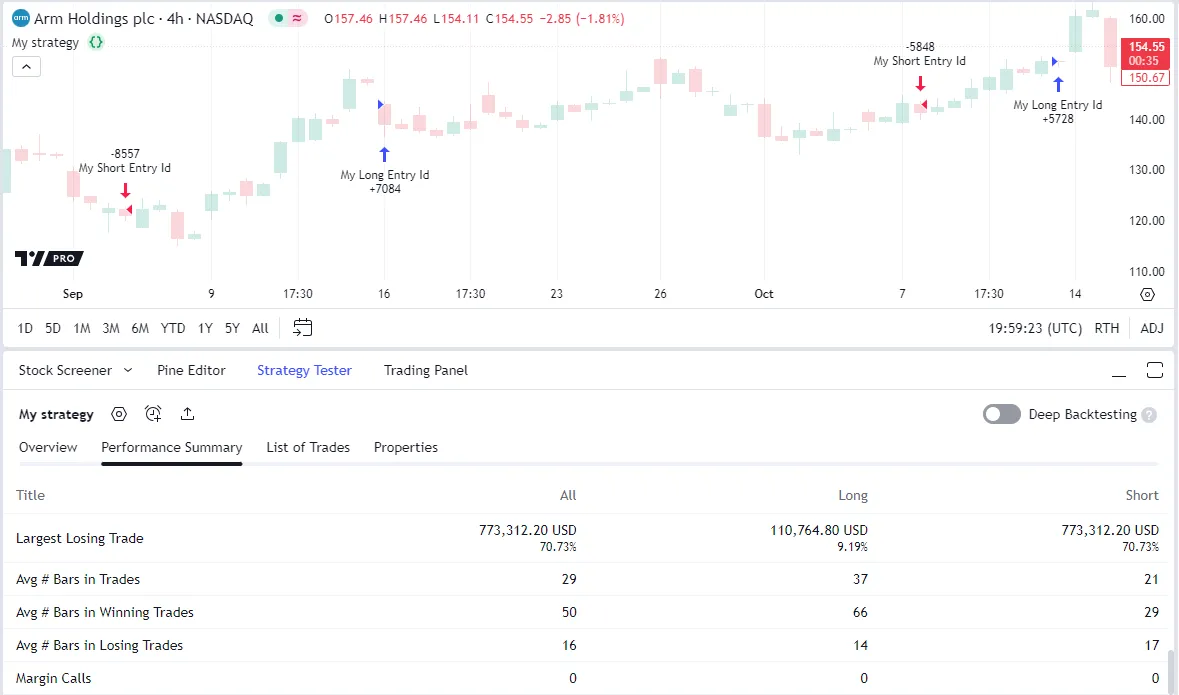
However, if we adjust this script to //@version=6 on the same chart, we see that it triggers 14 margin calls because of the new margin percentages:
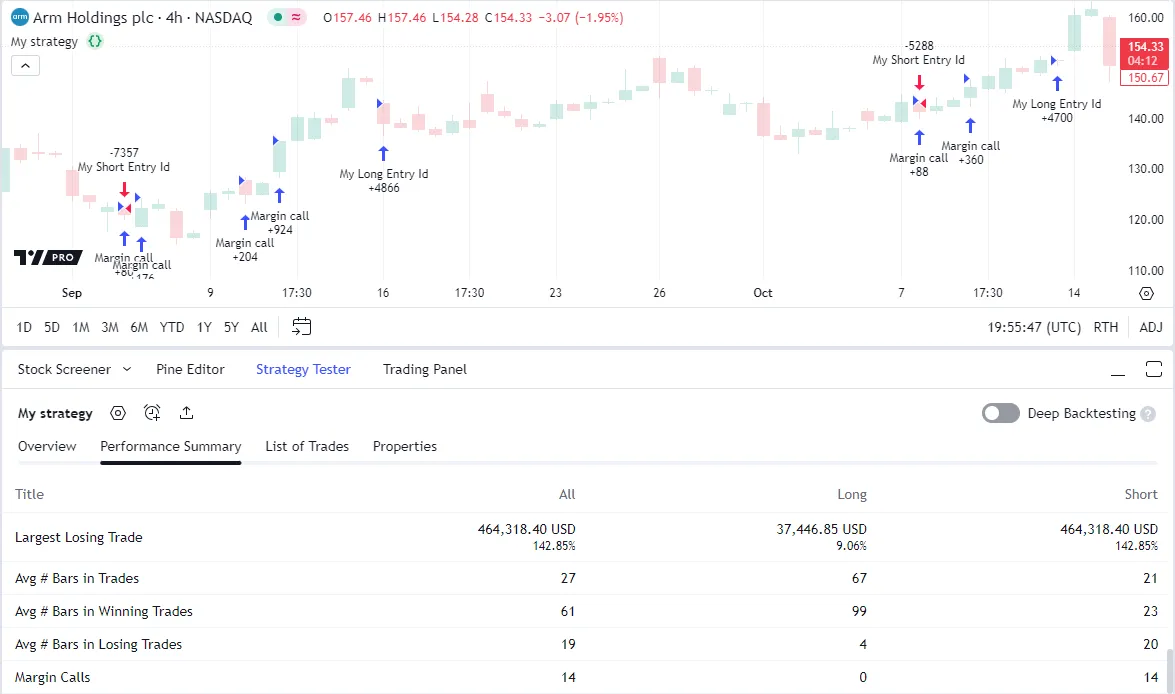
Fix: To replicate the previous v5 behavior, set the strategy() function’s margin_short and margin_long arguments to 0.
Excess orders are trimmed
Strategy orders above the 9000 limit are trimmed (removed) in v6.
In v5, outside of Deep Backtesting, when a strategy creates more than 9000 orders, it raises a runtime error and halts any further calculations.
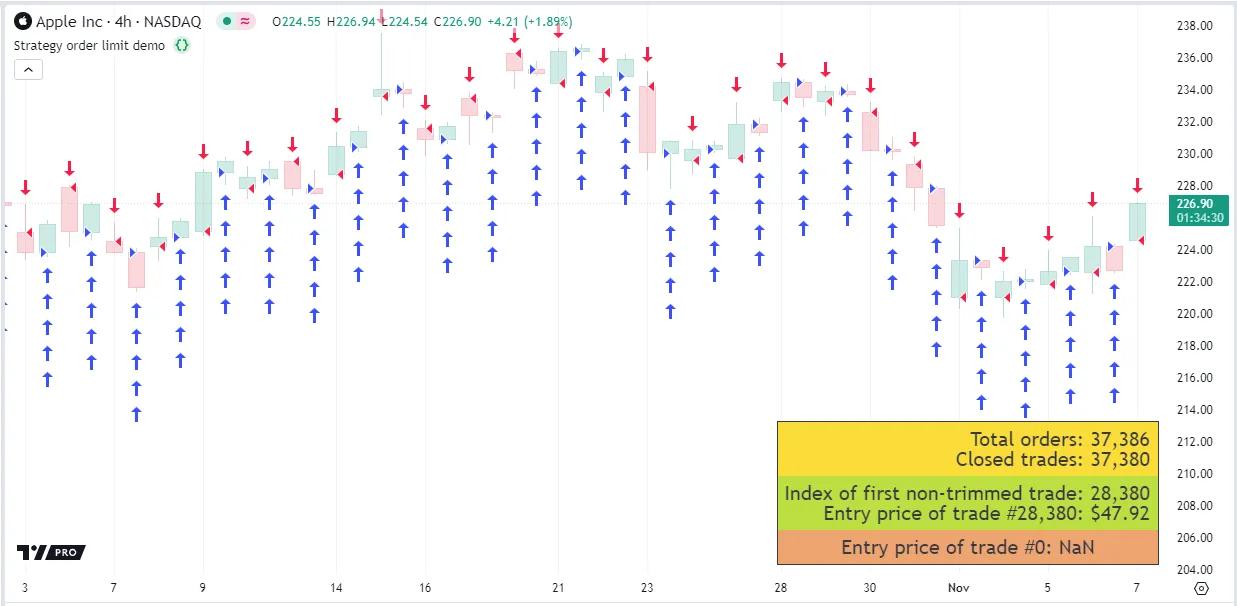
For example, this strategy script places several orders on each bar in the dataset. As a result, it can quickly surpass the 9000 order limit and trigger an error in Pine v5:
In v6, when the total number of orders exceeds 9000, the strategy does not halt. Instead, the orders are trimmed from the beginning until the limit is reached, meaning that the strategy only stores the information for the most recent orders.
Trimmed orders no longer show in the Strategy Tester, and referencing them using the strategy.closedtrades.* functions returns na. Use strategy.closedtrades.first_index to get the index of the first non-trimmed trade:
strategy.exit() evaluates parameter pairs
The strategy.exit() function has three sets of relative and absolute parameters that define price levels for exit order calculations. The relative parameters profit, loss, and trail_points specify the take-profit and stop-loss levels and trailing stop activation level as tick distances from the entry price. In contrast, the absolute parameters limit, stop, and trail_price specify the exit and trail activation prices directly.
In Pine v5, a strategy.exit() call containing arguments for both the relative and absolute parameters that define a price level for the same exit order always prioritizes the absolute parameter and ignores the relative one. For instance, a call that includes a limit and profit argument consistently places take-profit orders at the limit value. It never places an exit order using the profit distance.
In Pine v6, if a strategy.exit() call contains arguments for related absolute and relative parameters, it evaluates both specified levels and uses the one that the market price is expected to trigger first.
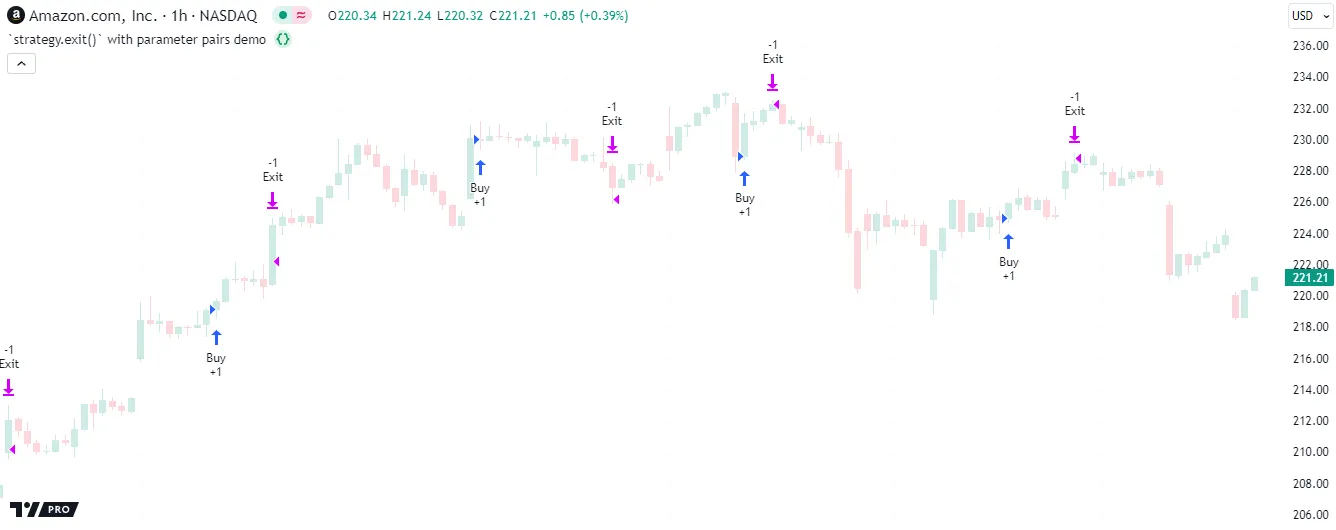
The example below demonstrates how the behavior of this command differs for v5 and v6 scripts. This v5 script creates a long market order and an exit order bracket on each 28th bar. The strategy.exit() call contains arguments for the relative parameters that determine take-profit and stop-loss levels (profit and loss), and it includes arguments for the absolute parameters (limit and stop). The profit and loss arguments are both 0, which would result in consistent exits at the entry price if the command used them. However, the command never uses these values to determine the exit order levels because the limit and stop parameters always take precedence when they have specified values:
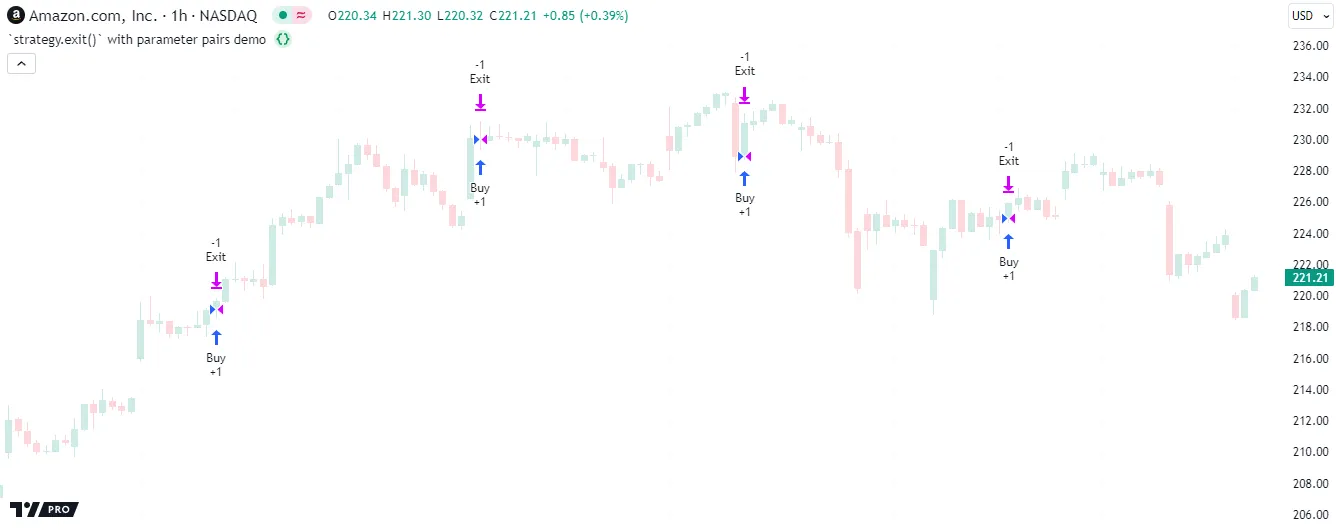
If we convert the script to Pine v6, its behavior changes. Instead of prioritizing the absolute limit and stop parameters exclusively, the strategy.exit() command always prioritizes the price levels that will trigger exits first. In this example, the market price reaches the limit or stop value after the profit and loss distance of 0 ticks. Consequently, the command ignores the limit and stop values and places its exit orders at the entry price, which causes the strategy to exit each trade immediately after opening it:
History-referencing operator
Pine v6 contains several changes to referencing the history of values.
No history for literal values
The history-referencing operator [] can no longer be used with literal values or built-in constants.
In v5, the history-referencing operator [] can be used with built-in constants, such as true and color.red, and with literals, which are raw values used directly in a script that are not stored as variables, such as 6 or "myString", etc.
However, referencing the history of a literal is usually redundant, because by definition every literal represents a fixed value. The only exception where the returned historic value may vary is if the historical offset points to a non-existent bar, in which case referencing the historic literal value returns na.

In Pine v6, you can no longer use the history-referencing operator [] on literals or built-in constants. Trying to do so triggers a compilation error.
Fix: Remove any [] operators used with literals or constants.

History of UDT fields
The history-referencing operator [] can no longer be used directly on fields of user-defined types.
In v5, you can use the history-referencing operator [] on the fields from objects of user-defined types. While this does not cause any compilation errors, the behavior itself is erroneous.
For example, the script below draws an arrow label on each bar and displays its percentage increase/decrease. The label style, color, and text are set based on a bar’s direction (close > open). The script defines a UDT LblSettings to initialize an object on each bar that stores these settings. On the last bar, it draws a table cell that displays the arrow direction and percentage difference from 10 bars back. In v5, we could use the history-referencing operator [] on the required LblSettings fields directly:
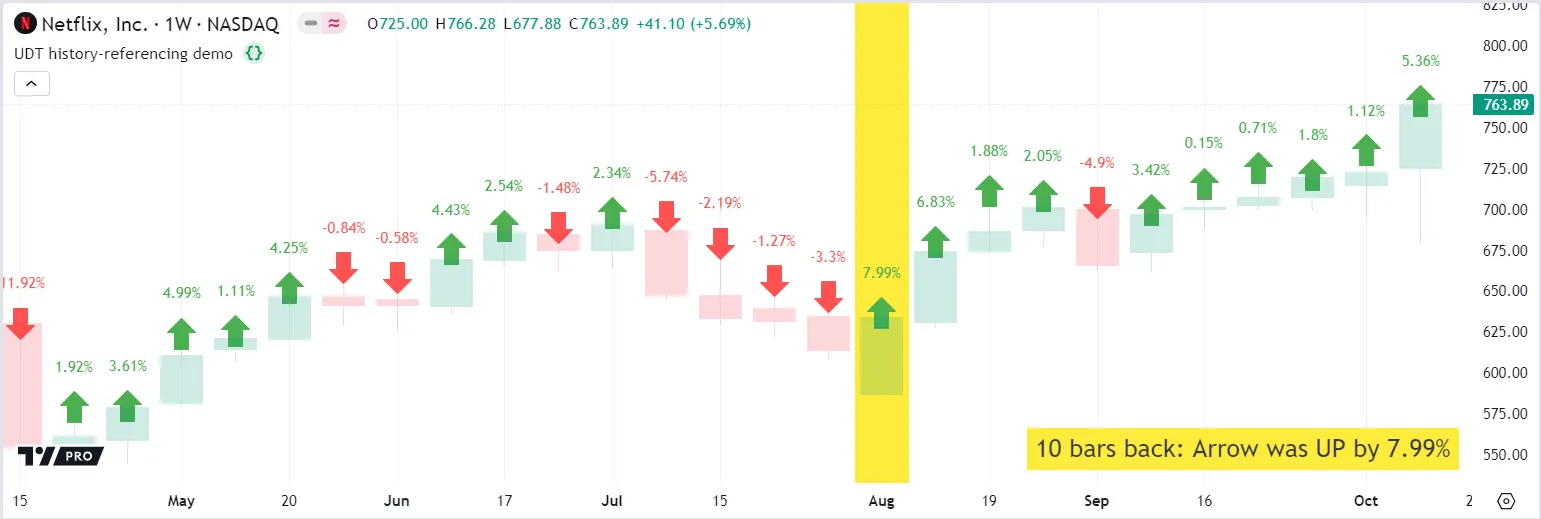
In Pine v6, you can no longer use the history-referencing operator [] on the field of a user-defined type directly.
Fix: Use the history-referencing operator on the UDT object instead, then retrieve the field of the historic object. To do so, use the syntax (myObject[10]).field - ensure the object’s historical reference is wrapped in parentheses, otherwise it is invalid. Alternatively, assign the UDT field to a variable first, and then use the history-referencing operator [] on the variable to access its historic value.
Therefore, we can adjust the v5 code to access a historic instance of our infoObject on the last bar, wrapped in parentheses. Then, we retrieve our desired field values from the historic object (infoObject[10]) to display the arrow direction and percentage difference from 10 bars back:
Timeframes must include a multiplier
The timeframe.period variable holds a “string” that represents the chart’s timeframe, typically consisting of a quantity (multiplier) and unit.
In v5, the timeframe.period variable does not include a quantity when the chart timeframe has a multiplier of 1. Instead, the string consists of only the timeframe unit, e.g., "D", "W", "M". This is inconsistent with the timeframe strings for these same units at higher intervals, e.g., "2D", "3M".
To simplify the timeframe format in v6, the timeframe.period variable now always includes a multiplier with its timeframe unit. So, "D" becomes "1D", "W" becomes "1W", and "M" becomes "1M".
This change might affect the behavior of older scripts that used == to compare the value of timeframe.period with the “string” representation of a timeframe directly (e.g., timeframe.period == "D").
To show the difference between the v5 and v6 timeframe.period variables, we ran the script below on a daily chart (1D) for each Pine version. The script displays the timeframe.period string in a table, and compares the variable’s value with the “string” literals "D" and "1D":
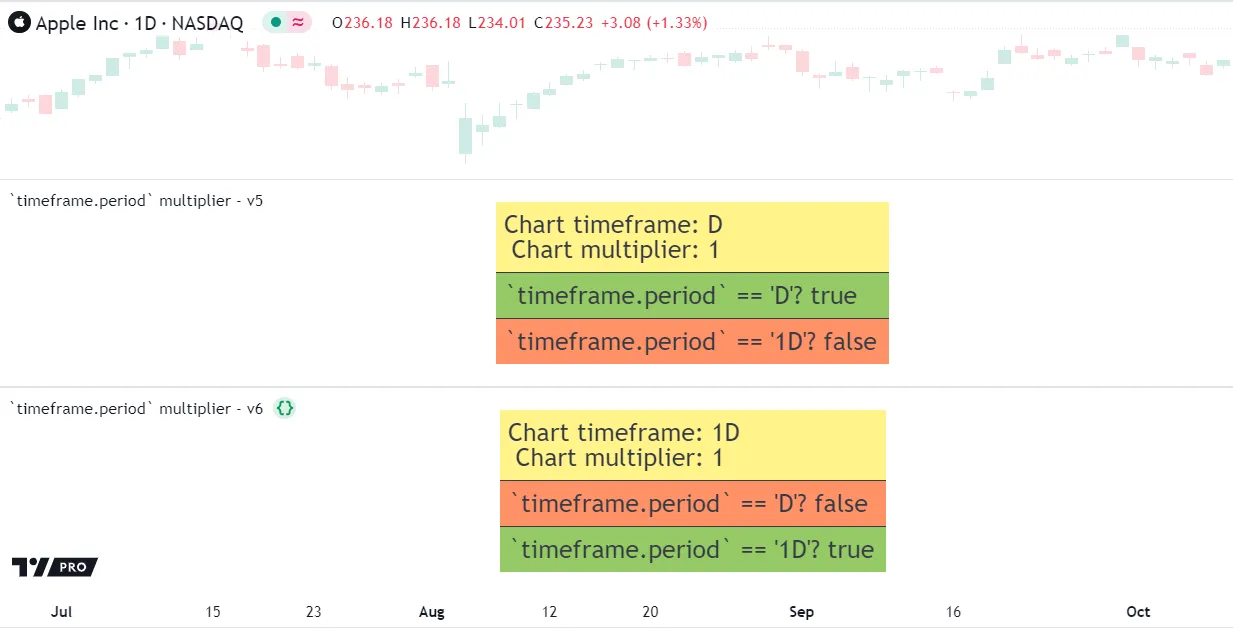
Fix: In general, ensure that all timeframe strings include a multiplier. In this example, change the timeframe comparison “string” (timeframe.period == "D") to ensure the “string” literal includes a multiplier (timeframe.period == "1D").
Lazy evaluation of conditions
The and and or conditions are now evaluated lazily rather than strictly.
An and condition is true if all of its arguments are true, which means that if the first argument is false, we can deduce that the whole condition is false, regardless of the value of the second argument. Conversely, an or condition is true when at least one of the arguments is true, so if the first argument is already true, then the whole condition is true, regardless of the second argument’s state.
Pine v5 evaluates all bool expressions except for the ?: ternary operator strictly, meaning the second part of a conditional expression is always evaluated, regardless of the value of the first argument.
Lazy evaluation can have consequences for script calculation. In the example below, we assign a value of true to the signal variable only when close > open and ta.rsi(close, 14) > 50. The ta.rsi() function must be executed on every bar in order to calculate its result correctly. In v5, the function is called on every bar, even when close > open is not true, due to the strict bool evaluation, and therefore the function calculates correctly.
In v6, bool expressions are evaluated lazily, which means the expression stops evaluating once it determines the overall condition’s result, even if there are other arguments remaining in the expression.
If we convert the script above to v6, we see that the plotted signals differ between the two scripts. This variation occurs because of the lazy bool evaluation – since an and condition is only true if all its arguments are true, when close > open is false, the and condition is definitely false regardless of the second argument ta.rsi(close, 14) > 50. Consequently, the ta.rsi() call is not evaluated on every bar, which interferes with the internal history that the RSI function stores for its calculation and results in incorrect values:
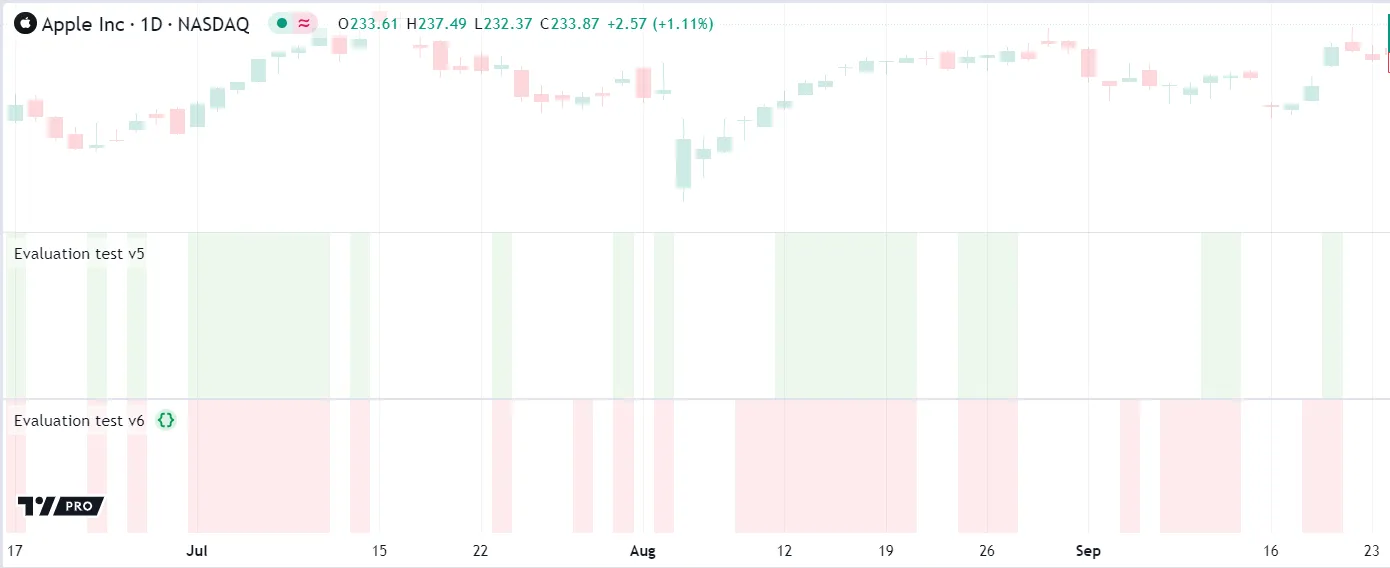
Fix: Ensure that the script evaluates all functions that rely on previous values on each bar. For example, extract calls that rely on historical context to the global scope and assign them to a variable. Then, reference that variable in the and and or conditions.
Note that you can and should take advantage of the lazy bool evaluation to create smarter, more concise code.
For example, the script below calls array.first() on an array that is occasionally empty (on bars where close > open is false). In Pine v5, calling array.first() on an empty array results in a runtime error, so you must keep the two if-conditions that check the array size and first element separated in different scopes to avoid the error. However, in Pine v6, you can have the two conditions in the same scope without error because the and condition’s lazy evaluation ensures that array.first() will only be called if array.size() != 0 is true first:
Cannot repeat parameters
In v5, you can specify the same parameter in a function more than once. However, doing so raises a compiler warning, and only the first value will be used.
In v6, you can specify a parameter only once, and doing otherwise will result in a compilation error.
Fix: Remove the duplicate parameters.
No series offset values
The offset parameter can no longer accept “series” values
In Pine v5, the offset parameter in plot() and similar functions can accept “series int” arguments. However, passing a “series” argument raises a compiler warning, and the behavior is incorrect: only the last calculated offset is used on the whole chart, regardless of its previous values.
For example, this script uses bar_index / 2 as a “series” offset argument while plotting the high points of each bar’s body. Because the plot() function uses only the last offset value, the plot appears offset by 10 bars here for the entire “GOOGL” 12M chart (since the chart’s last bar_index is 20 here):
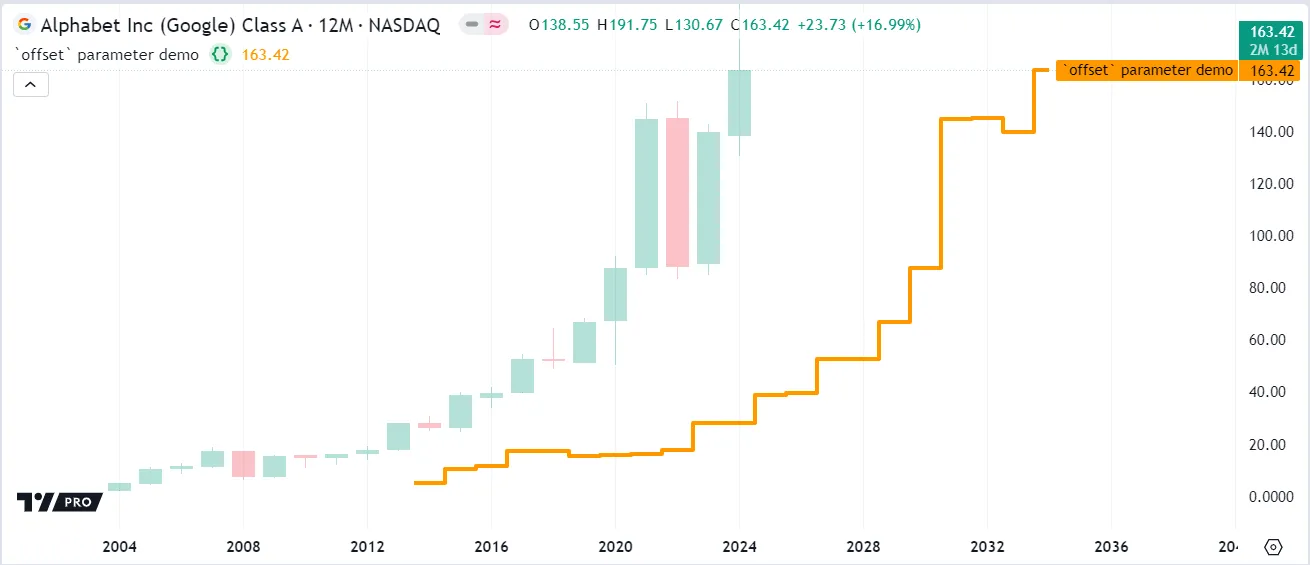
In v6, the offset parameter accepts an argument qualified as “simple” or weaker. The value used must be the same on every bar.
Remember that the Pine Script qualifiers hierarchy means that a parameter expecting a “simple” value can also accept values qualified as “input” or “const”. However, passing a “series” argument triggers a compilation error.
Fix: Change any “series” values passed to offset to “simple” values.
Minimum linewidth is 1
In v5, the linewidth parameter of the plot() and hline() functions can accept a value smaller than 1, although the width on the chart will still appear as 1 for these drawings:

In v6, the linewidth argument must be 1 or greater. Passing a smaller value causes a compilation error.
Fix: Replace any linewidth argument that is smaller than 1 to ensure all width values are at least 1.

Negative indices in arrays
Some array functions now accept negative indices.
In v5, array functions that require an element’s index always expect a value greater than or equal to 0. Therefore, functions like array.get(), array.insert(), array.set(), and array.remove() raise a runtime error if a negative index is passed.
In v6, array.get(), array.insert(), array.set(), and array.remove() allow you to pass a negative index to request items from the end of the array. For example, -1 refers to the last item in the array, -2 refers to the second to last, and so forth.
As a result, scripts that return a runtime error for using negative indices in v5 can be executed without error in v6.
However, if you create or update a script in v6, you must be aware of this new behavior to ensure that the script does not behave unexpectedly.
Keep in mind that negative indexing is still bound by the size of the array. Therefore, an array of 5 elements only accepts indexing from 0 to 4 (first to last element) or -1 to -5 (last to first element). Any other indices are out of bounds and raise a runtime error:
The transp parameter is removed
In Pine v4 and earlier, plot() and similar functions had a transp parameter that specified the transparency of the resulting plot.
Pine v5 deprecated and hid the transp parameter, because it is not fully compatible with the color system that Pine currently uses. Using both transparency settings together can result in unexpected behavior, as the transp parameter can get overwritten by the transparency of the color passed to the function. In v5, using the color.new() function and not the transp parameter avoids any such conflicts.
Pine v6 removes the transp parameter completely from the following functions: bgcolor(), fill(), plot(), plotarrow(), plotchar(), and plotshape(). Whenever the converter encounters a transp argument, it removes the argument from the converted v6 script.
Fix: To set the transparency of a drawn plot, use the color.new() function. Pass the color value as the first argument, and the desired transparency value as the second.
For example, this v5 code uses the hidden transp parameter to set the color of the plot to 80 transparency:
In Pine v6, the same result can be achieved using color.new():
If you need to preserve the color inputs in the “Settings/Style” menu, you must ensure that every color that gets passed to every color.new() call is qualified as either “const” or “input”. If at least one of these color values is calculated dynamically (like the code above), the color selector does not appear in the settings:
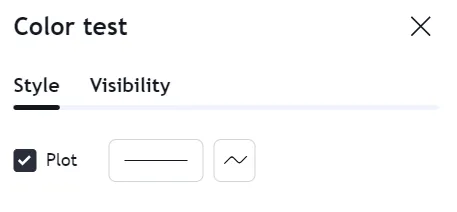
You can learn more about why this happens and how to avoid it here.
Dynamic for loop boundaries
A for loop is a count-controlled loop that executes successive iterations of its local block based on a counter variable. The counter starts with an initial value (from_num) and increases or decreases by a fixed amount after every iteration until it reaches the specified final value (to_num).
In Pine v5, a for loop statement establishes its final counter value strictly before starting its iterations. If the script changes the value of a variable or expression used as the loop’s to_num argument during the loop’s iterations, those changes do not affect the counter’s boundaries. This behavior differs from while and for…in loops, which have control criteria that can change across iterations.
In Pine v6, all for loops dynamically evaluate their stopping criteria before each iteration. Variables and expressions used as the to_num argument that depend on values or objects modified in the loop’s scope can update the counter variable’s boundaries across iterations. This behavior enables scripts to use a for loop for iterative tasks where the exact iteration boundaries are unknown before the loop starts.
Because for loop boundaries can be dynamic in Pine v6, a v5 script using this loop structure with a mutated variable or dynamic expression such as array.size(id) - 1 as the to_num argument can behave differently after conversion to v6.
Fix: If a for loop requires only one evaluation of an expression used as the to_num argument across iterations, assign the expression to a variable outside the loop’s scope, then use that variable as the to_num argument instead.
The following v5 example uses two user-defined methods to manage the elements in an array. The script calls the dequeue() method before a for loop to remove the first element from the data array. Then, it calls the queue() method inside the loop statement to add the current bar’s close into the array and return the array’s size for the loop’s end boundary. Within the loop’s scope, the script increments the belowCount variable by one for each element with a value below the current bar’s ohlc4 value:
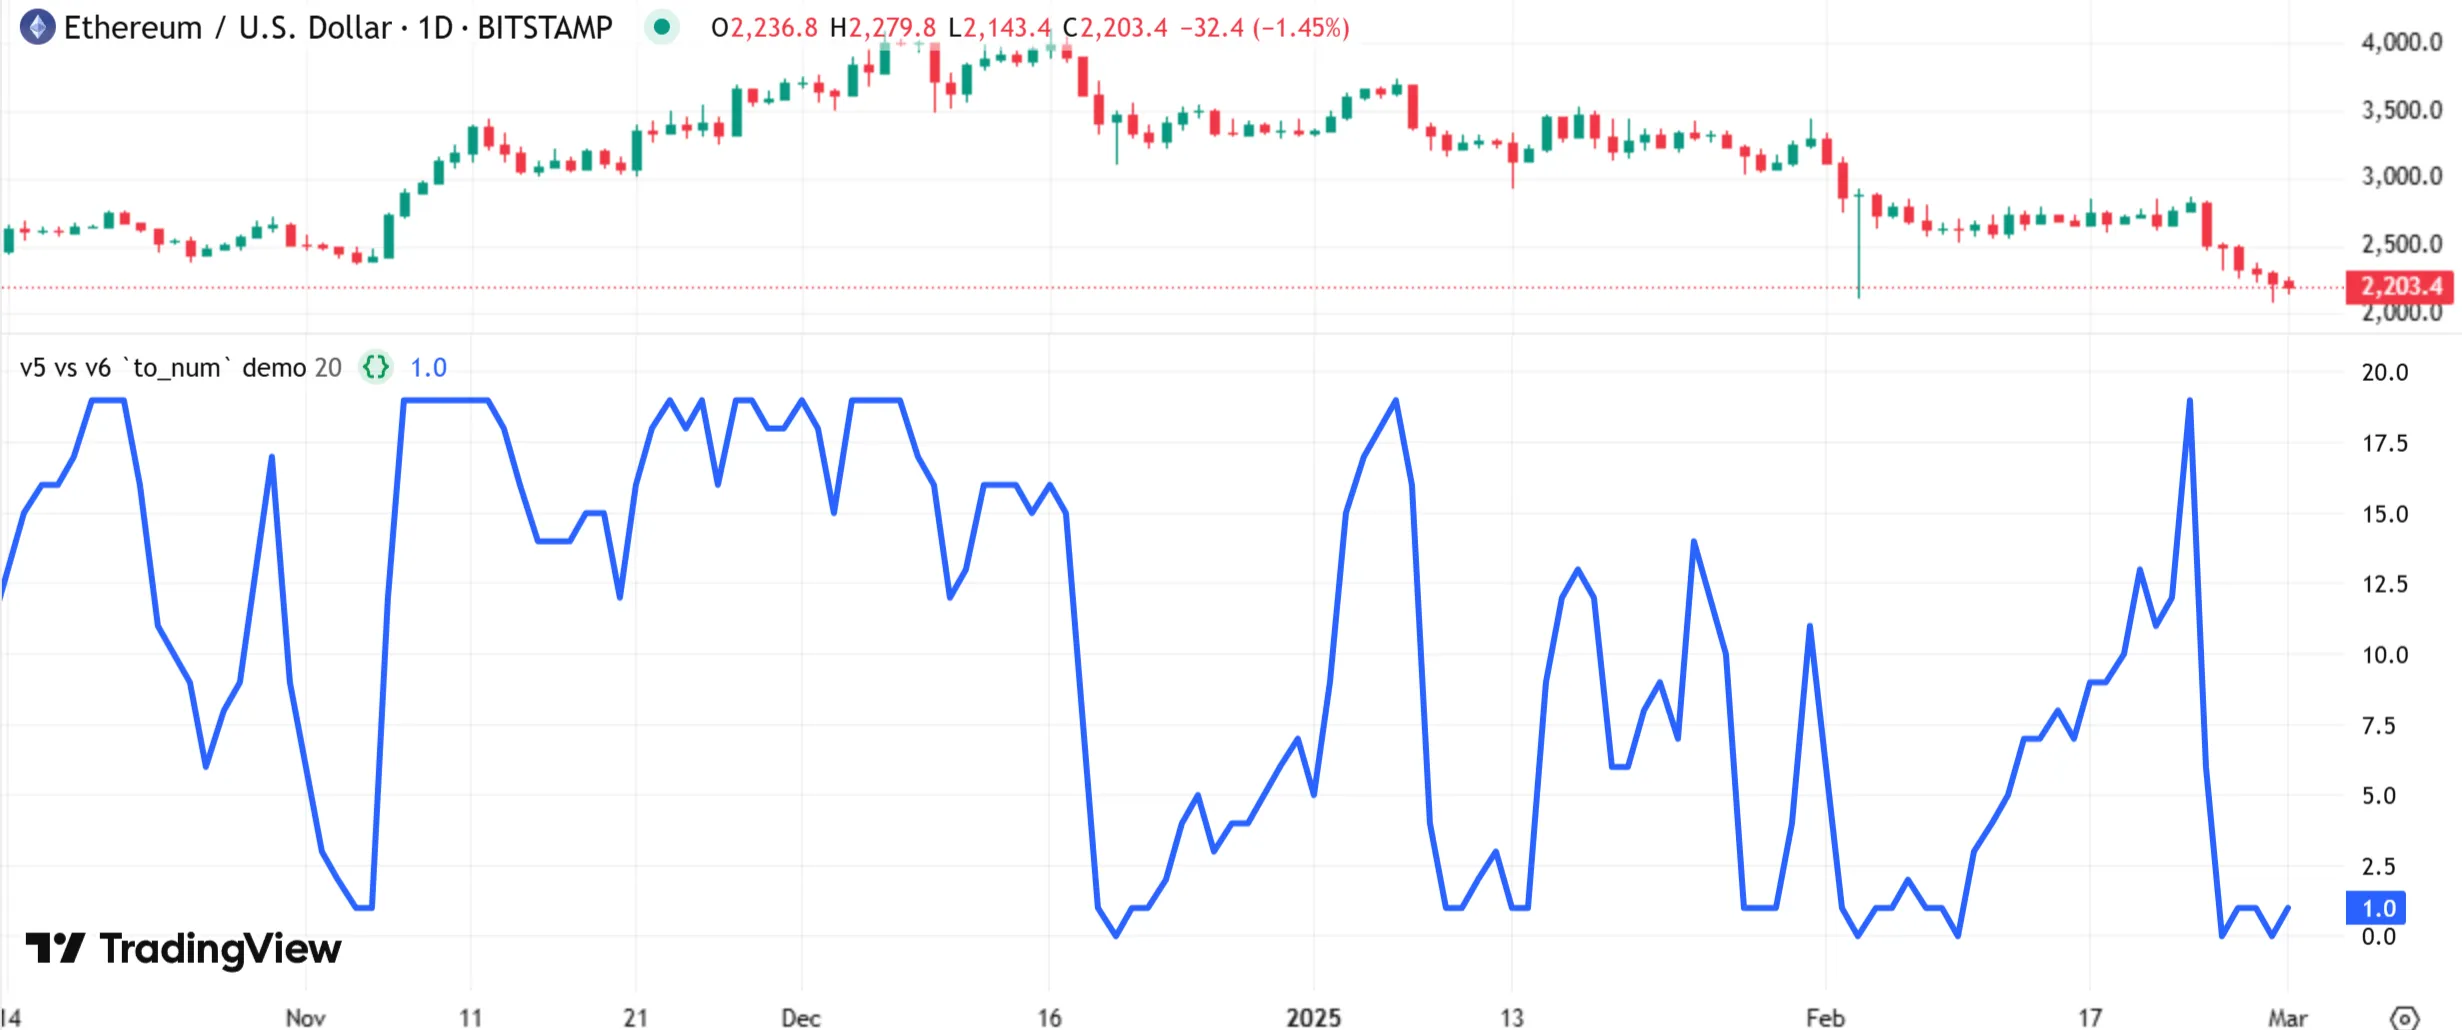
In v5, the above loop statement evaluates data.queue(close) - 1 only once, before it starts the first iteration. It does not execute that expression again across iterations. As such, each script execution queues exactly one new value into the data array, and the number of times the loop executes its local code does not change while the loop runs.
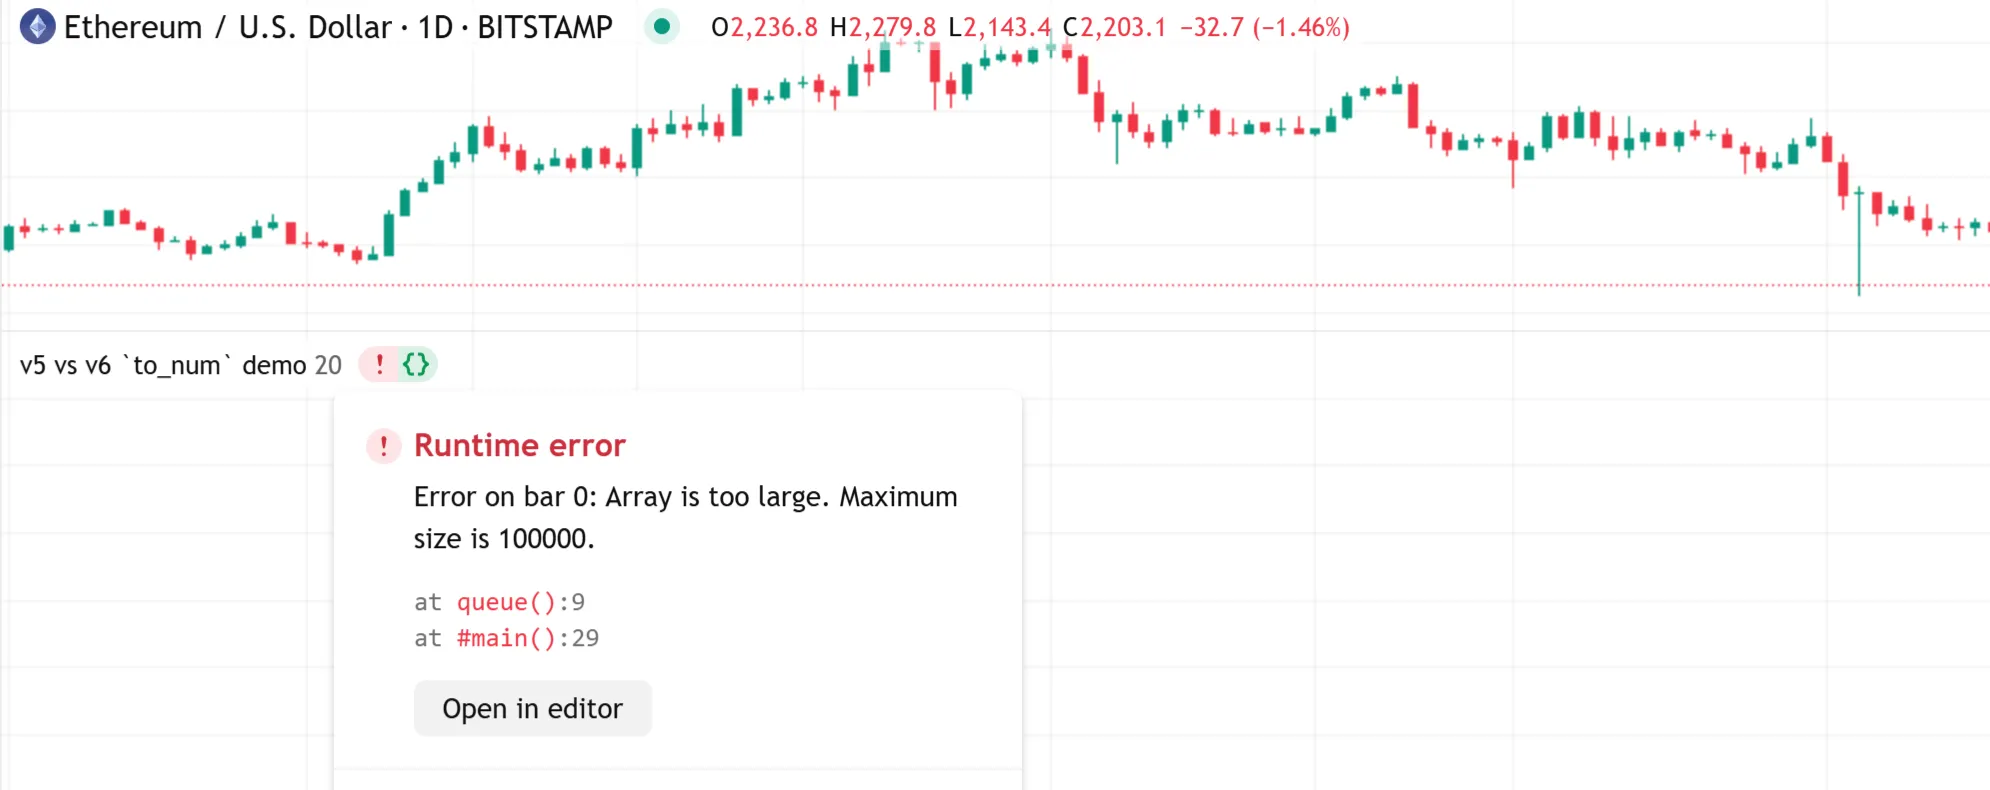
However, the script does not work after conversion to v6, because the for loop evaluates data.queue(close) - 1 before every iteration. Each evaluation of the expression adds a new element to the data array and increases the to_num boundary, causing the loop to iterate indefinitely until the script raises a runtime error:
We can fix the script’s behavior by assigning the expression’s initial result to a variable outside the loop’s scope and using that variable in the for loop statement. This change prevents the expression from modifying the array’s size or altering the loop’s end boundary between iterations: