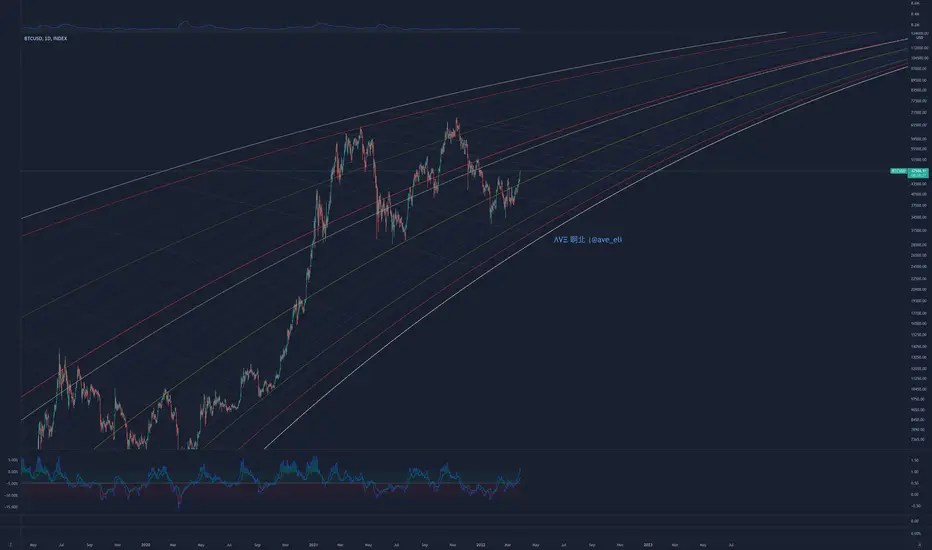
This is one of the most important charts I've ever made for #Bitcoin
There's a lot to these exact angles of approach, they go back to the first bull market and they continue to be relevant even today. And they all converge at 171k USD
The top band in white historically has never been broken by BTC - it retraces there, and then finds new market support. I trace a new band there to 171k, which becomes the support for the next bull - when that band is broken the market capitulates, every time.
You can see these supports color-coded across the whole chart, and see their continued significance across in the following bull market cycles. The firstBTC market support in yellow, the second in red + white area then the yellow and white again.
A key element in all of this is that the convergence at 171k means the overall chart is rising in a curved Rising Wedge, prices reach the top, falls to the bottom, and breaks down, finds new support, and that new support carries onto the nextBTC bull market
But overall the area of bull market expansion narrows over time - meaning the wholeBTC supercycle from $0.06 to today grows into a rising wedge, and it is runnings out of space - 171k being the convergence of all of these log curves.
For the current #bitcoin price action, every time prices cross one of these old markets supports it capitulates hard. But it is likely to find buyers at the next key one. But if the price loses the last yellow bottom one then the last white one this cycle's realBTC capitulation will hit.
If theBTC price turns bullish either after new capitulation or simply turns above the middle white log curve and runs hard, then it is more likely than not to stop at the white log at the top since #bitcoin has never broken it.
My guess is thatBTC is more likely to break the bottom white log curve support, find a new bottom, then do it all again
There's a lot to these exact angles of approach, they go back to the first bull market and they continue to be relevant even today. And they all converge at 171k USD
The top band in white historically has never been broken by
You can see these supports color-coded across the whole chart, and see their continued significance across in the following bull market cycles. The first
A key element in all of this is that the convergence at 171k means the overall chart is rising in a curved Rising Wedge, prices reach the top, falls to the bottom, and breaks down, finds new support, and that new support carries onto the next
But overall the area of bull market expansion narrows over time - meaning the whole
For the current #bitcoin price action, every time prices cross one of these old markets supports it capitulates hard. But it is likely to find buyers at the next key one. But if the price loses the last yellow bottom one then the last white one this cycle's real
If the
My guess is that
إخلاء المسؤولية
لا يُقصد بالمعلومات والمنشورات أن تكون، أو تشكل، أي نصيحة مالية أو استثمارية أو تجارية أو أنواع أخرى من النصائح أو التوصيات المقدمة أو المعتمدة من TradingView. اقرأ المزيد في شروط الاستخدام.
إخلاء المسؤولية
لا يُقصد بالمعلومات والمنشورات أن تكون، أو تشكل، أي نصيحة مالية أو استثمارية أو تجارية أو أنواع أخرى من النصائح أو التوصيات المقدمة أو المعتمدة من TradingView. اقرأ المزيد في شروط الاستخدام.