waltzing within the box
timing markets is virtually impossible
we don't have crystal ball🔮 and hence we don't predict or speculate.
let's dance with the index
From yesterday post, from the indicators we keep an eye to monitor as it may rebound...
so is this the rebound ?(yes maybe short-term).
A full reversal? again, we don't know! But, don't think so, always cross-check with broader tf - D Chart. It's still at bearish zone; oversold zone (continue to monitor....)
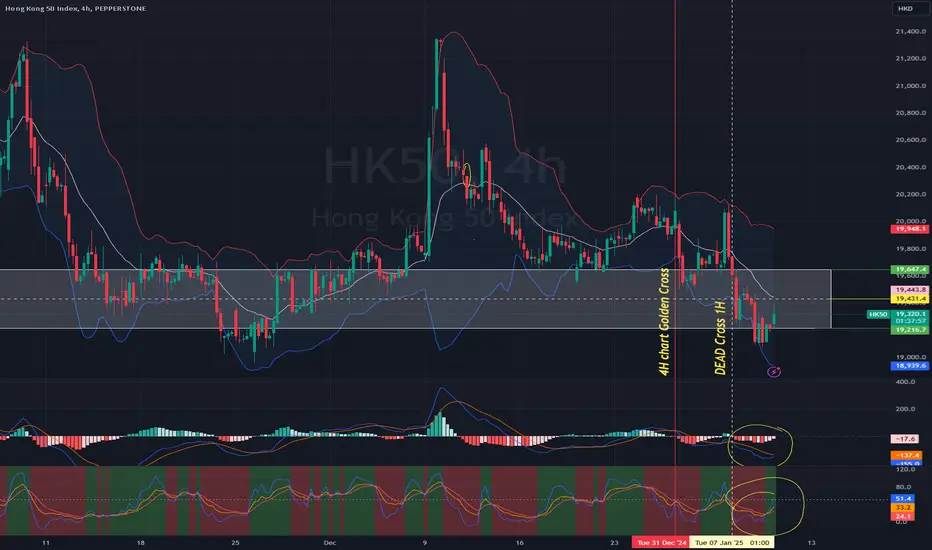
From the 4H chart
Both MACD & KDJ turned around giving reversal signs.
MACD - although still below zero level but we can see the lines are curving up.
KDJ - turned into bullish green zone, indicating uptrend signal.
The 1H chart - the Index moving within the box. You may use BB indicator to get the range too.The previous range red box 19000 - 19200.
Support : 19200 if breaks then next 18960)
Resistance :19440 (if breaks then 19647, then 19945).
For day trade: Same strategy, sell at resistance; buy/TP into support.
Monitor the 1H,4H movement with confirmation using MACD & KDJ indicator.
For swing trade : Set your tf, entry and exit plan.
For slightly mid-long term trade (more than 9months - 36months++) : You may plan and DCA the Index. You may take a long position on HSI Tracker Fund 2800.
The index is currently in a discount zone, check the historical price; there are ample of room to reach its ATH @33500. The law of attraction; we know that whatever bottom eventually rebound, it's the matter of time.
DYODD. Plan your trade, do not listen to anyone including this post!
Profitable traders/investors take contrarian moves. It's challenging but worth spending some time to think:- Ultimately what we want to achieve from our action/trading...
Sticktoyourplan follow your trading strategy. Set your SL/TP.
Once set, you may zen with 📙 and 🍵 wait for the results.
Happy Trading Everyone!
منشورات ذات صلة
إخلاء المسؤولية
لا يُقصد بالمعلومات والمنشورات أن تكون، أو تشكل، أي نصيحة مالية أو استثمارية أو تجارية أو أنواع أخرى من النصائح أو التوصيات المقدمة أو المعتمدة من TradingView. اقرأ المزيد في شروط الاستخدام.