Orange Breaks, We Fly. Blue Falls, We Dive.
The chart highlights two critical regions, each playing a pivotal role in determining the next trend direction for IBIT Bitcoin shares:
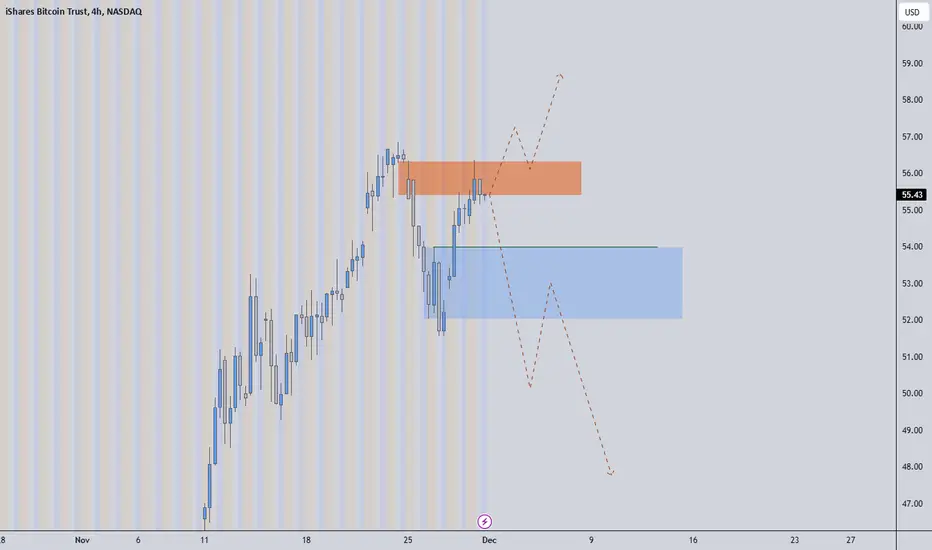
Orange Box - Key Resistance Zone
The orange box represents a crucial resistance area. For the rally to sustain momentum and push higher, this region must be decisively broken and secured. A close above this level, coupled with strong volume, would indicate the bulls are in control, signaling a potential continuation of the upward trend.
Blue Box - Key Support Zone
The blue box acts as a significant support level. Should the price fall below this zone, it would suggest weakness in the market. A confirmed breakdown, followed by a retest of the orange box from below, provides an opportunity to take a short position, as this would signal the onset of a downtrend.
Conclusion:
These zones are pivotal for the current market structure. Traders should closely monitor price action around these levels to identify whether the market leans towards bullish continuation or bearish reversal.
Professional Day Trader
Microstructure Practicioner
t.me/umuttrades
Microstructure Practicioner
t.me/umuttrades
منشورات ذات صلة
إخلاء المسؤولية
لا يُقصد بالمعلومات والمنشورات أن تكون، أو تشكل، أي نصيحة مالية أو استثمارية أو تجارية أو أنواع أخرى من النصائح أو التوصيات المقدمة أو المعتمدة من TradingView. اقرأ المزيد في شروط الاستخدام.