PROTECTED SOURCE SCRIPT
[MBBTI] BTC Thot

Hello Traders,
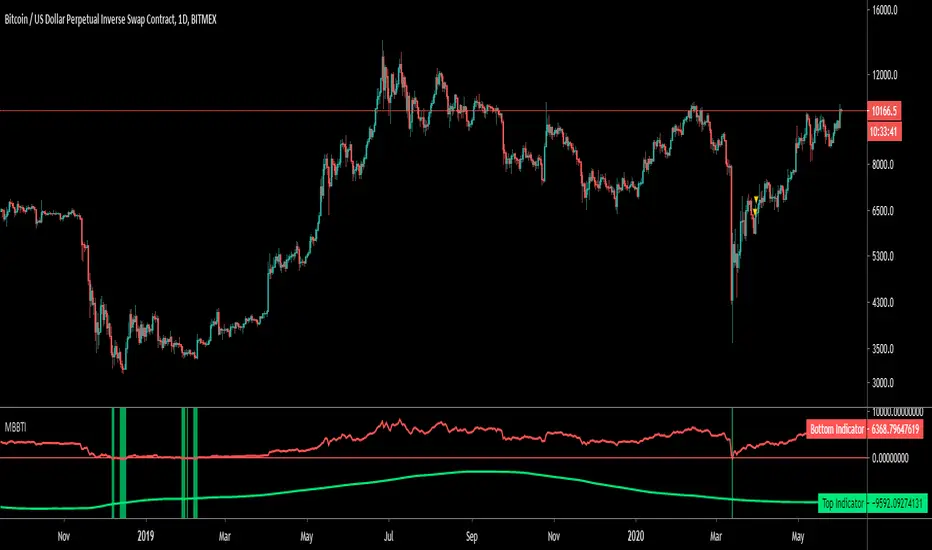
Thot is indicator which utilizes moving averages to indicate the potential high or bottom.
How it works?
- it utilizes different moving averages and weighting them with fibonacci multiples.
- some crosses proved indicating highs and lows in the past
- red indicates potential high
- green indicates potential low
- only good on daily chart
- check BLX for past performance
Note: This is based on past performance an not quarantining any future performance.
Contact me if you have any questions or change requests
Wuuzzaa
نص برمجي محمي
تم نشر هذا النص البرمجي كمصدر مغلق. ومع ذلك، يمكنك استخدامه بحرية ودون أي قيود - تعرف على المزيد هنا.
إخلاء المسؤولية
لا يُقصد بالمعلومات والمنشورات أن تكون، أو تشكل، أي نصيحة مالية أو استثمارية أو تجارية أو أنواع أخرى من النصائح أو التوصيات المقدمة أو المعتمدة من TradingView. اقرأ المزيد في شروط الاستخدام.