PROTECTED SOURCE SCRIPT
Relative Measured Volatility [Seven Campbell]
Relative Measured Volatility
Overview:
This indicator measures the current daily volatility of an asset and compares it to the average volatility observed over the past 15 days. It provides a dynamic gauge of how much the market’s volatility is deviating from its recent historical norms.
Key Features:
Dynamic Comparison: The indicator calculates the standard deviation of daily price changes over a user-defined period (default is 14 days) and compares it to a smoothed average of this volatility over the last 15 days. This creates a "moving measuring stick" to highlight periods of unusually high or low volatility.
Customizable Settings:
Lookback Period: Set to 15 days by default, this period defines the historical window used to calculate the average volatility.
Volatility Length: Adjustable length (default is 14) for the standard deviation calculation, allowing you to fine-tune the sensitivity of the volatility measurement.
Smoothing Length: Set to 50 by default, this parameter smooths the volatility data to highlight longer-term trends.
How It Works:
Volatility Calculation: The indicator computes the daily returns using the logarithmic change in closing prices. It then calculates the standard deviation of these returns over the specified volatility length.
Smoothing: The standard deviation values are smoothed using a simple moving average over the smoothing length, providing a clearer view of trends.
Relative Measurement: The current daily volatility is divided by the smoothed volatility, giving a relative value. A value above 1 indicates higher volatility than the average over the past 15 days, while a value below 1 suggests lower volatility.
Visual Representation:
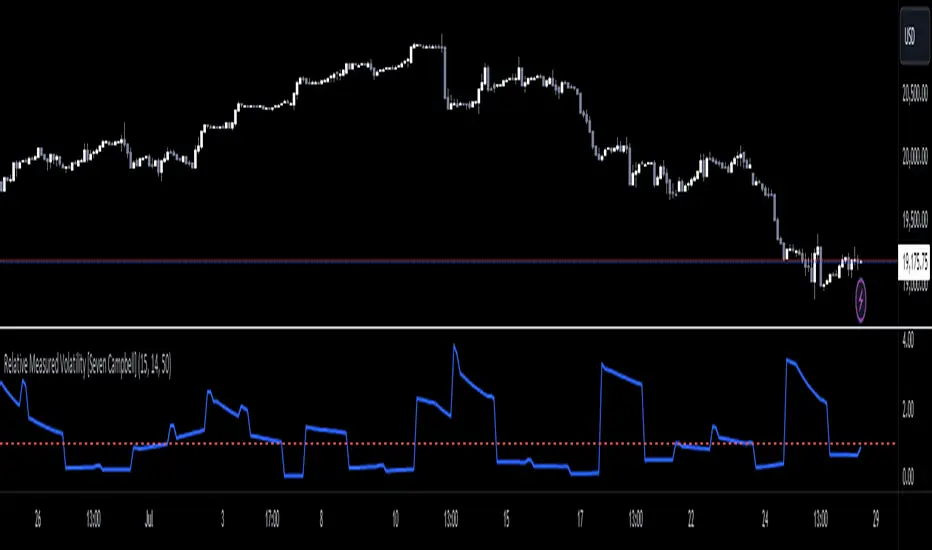
Line Plot: The relative volatility is plotted as a line, allowing you to quickly see changes in volatility relative to the historical average.
Reference Line: A horizontal line at 1 is included for easy reference. Values above this line indicate periods of higher-than-average volatility, and values below suggest lower-than-average volatility.
Use Cases:
Market Sentiment Analysis: Identify periods of high or low volatility to gauge market sentiment.
Trade Timing: Use the indicator to decide on entry and exit points, especially in volatile or calm market conditions.
Risk Management: Monitor volatility to adjust position sizes and stop-loss levels dynamically.
Example Usage:
When the line rises above 1, it signals increasing volatility, which may be a good time to take profit or adjust your stop-loss orders.
When the line drops below 1, it indicates lower volatility, potentially highlighting a stable market period.
Overview:
This indicator measures the current daily volatility of an asset and compares it to the average volatility observed over the past 15 days. It provides a dynamic gauge of how much the market’s volatility is deviating from its recent historical norms.
Key Features:
Dynamic Comparison: The indicator calculates the standard deviation of daily price changes over a user-defined period (default is 14 days) and compares it to a smoothed average of this volatility over the last 15 days. This creates a "moving measuring stick" to highlight periods of unusually high or low volatility.
Customizable Settings:
Lookback Period: Set to 15 days by default, this period defines the historical window used to calculate the average volatility.
Volatility Length: Adjustable length (default is 14) for the standard deviation calculation, allowing you to fine-tune the sensitivity of the volatility measurement.
Smoothing Length: Set to 50 by default, this parameter smooths the volatility data to highlight longer-term trends.
How It Works:
Volatility Calculation: The indicator computes the daily returns using the logarithmic change in closing prices. It then calculates the standard deviation of these returns over the specified volatility length.
Smoothing: The standard deviation values are smoothed using a simple moving average over the smoothing length, providing a clearer view of trends.
Relative Measurement: The current daily volatility is divided by the smoothed volatility, giving a relative value. A value above 1 indicates higher volatility than the average over the past 15 days, while a value below 1 suggests lower volatility.
Visual Representation:
Line Plot: The relative volatility is plotted as a line, allowing you to quickly see changes in volatility relative to the historical average.
Reference Line: A horizontal line at 1 is included for easy reference. Values above this line indicate periods of higher-than-average volatility, and values below suggest lower-than-average volatility.
Use Cases:
Market Sentiment Analysis: Identify periods of high or low volatility to gauge market sentiment.
Trade Timing: Use the indicator to decide on entry and exit points, especially in volatile or calm market conditions.
Risk Management: Monitor volatility to adjust position sizes and stop-loss levels dynamically.
Example Usage:
When the line rises above 1, it signals increasing volatility, which may be a good time to take profit or adjust your stop-loss orders.
When the line drops below 1, it indicates lower volatility, potentially highlighting a stable market period.
نص برمجي محمي
تم نشر هذا النص البرمجي كمصدر مغلق. ومع ذلك، يمكنك استخدامه بحرية ودون أي قيود - تعرف على المزيد هنا.
إخلاء المسؤولية
لا يُقصد بالمعلومات والمنشورات أن تكون، أو تشكل، أي نصيحة مالية أو استثمارية أو تجارية أو أنواع أخرى من النصائح أو التوصيات المقدمة أو المعتمدة من TradingView. اقرأ المزيد في شروط الاستخدام.