OPEN-SOURCE SCRIPT
VWAP Divergence
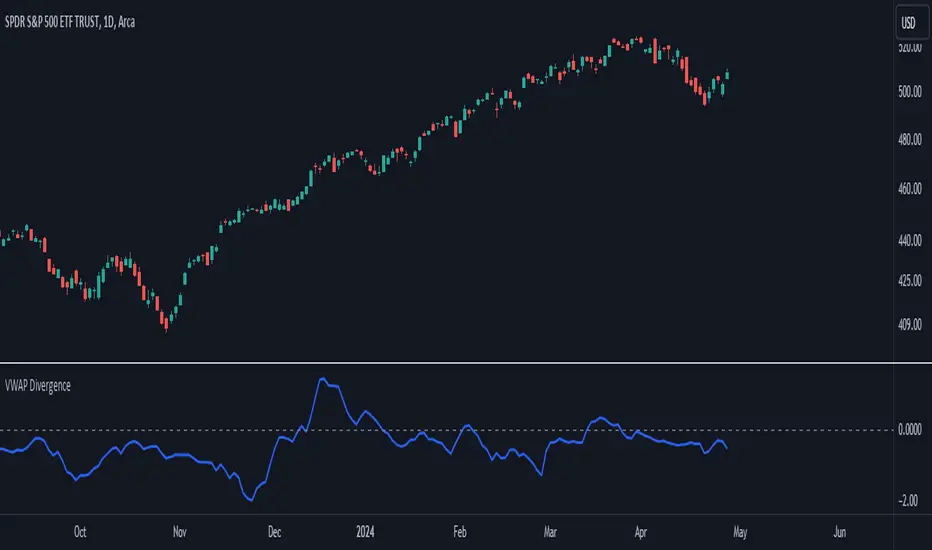
The "VWAP Divergence" indicator leverages the VWAP Rolling indicator available in TradingView's library to analyze price and volume dynamics. This custom indicator calculates a rolling VWAP (Volume Weighted Average Price) and compares it with a Simple Moving Average (SMA) over a specified historical period.
Advantages:
1. Accurate VWAP Calculation: The VWAP Rolling indicator computes a VWAP that dynamically adjusts based on recent price and volume data. VWAP is a vital metric used by traders to understand the average price at which a security has traded, factoring in volume.
2. SMA Comparison: By contrasting the rolling VWAP from the VWAP Rolling indicator with an SMA of the same length, the indicator highlights potential divergences. This comparison can reveal shifts in market sentiment.
3. Divergence Identification: The primary purpose of this indicator is to detect divergences between the rolling VWAP from VWAP Rolling and the SMA. Divergence occurs when the rolling VWAP significantly differs from the SMA, indicating potential changes in market dynamics.
Interpretation:
1. Positive Oscillator Values: A positive oscillator (difference between rolling VWAP and SMA) suggests that the rolling VWAP, derived from the VWAP Rolling indicator, is above the SMA. This could indicate strong buying interest or accumulation.
2. Negative Oscillator Values: Conversely, a negative oscillator value indicates that the rolling VWAP is below the SMA. This might signal selling pressure or distribution.
3. Divergence Signals: Significant divergences between the rolling VWAP (from VWAP Rolling) and SMA can indicate shifts in market sentiment. For instance, a rising rolling VWAP diverging upwards from the SMA might suggest increasing bullish sentiment.
4. Confirmation with Price Movements: Traders often use these divergences alongside price action to confirm potential trend reversals or continuations.
Implementation:
1. Length Parameter: Adjust the Length input to modify the lookback period for computing both the rolling VWAP from VWAP Rolling and the SMA. A longer period provides a broader view of market sentiment, while a shorter period is more sensitive to recent price movements.
2. Visualization: The indicator plots the VWAP SMA Oscillator, which visually represents the difference (oscillator) between the rolling VWAP (from VWAP Rolling) and SMA over time.
3. Zero Line: The zero line (gray line) serves as a reference point. Oscillator values crossing above or below this line can be interpreted as bullish or bearish signals, respectively.
4. Contextual Analysis: Interpret signals from this indicator in conjunction with broader market conditions and other technical indicators to make informed trading decisions.
This indicator, utilizing the VWAP Rolling component, is valuable for traders seeking insights into the relationship between volume-weighted price levels and traditional moving averages, aiding in the identification of potential trading opportunities based on market dynamics.
نص برمجي مفتوح المصدر
قام مؤلف هذا النص البرمجي بنشره وجعله مفتوح المصدر، بحيث يمكن للمتداولين فهمه والتحقق منه، وهو الأمر الذي يدخل ضمن قيم TradingView. تحياتنا للمؤلف! يمكنك استخدامه مجانًا، ولكن إعادة استخدام هذا الرمز في المنشور يخضع لقواعدقوانين الموقع. يمكنك جعله مفضلاً لاستخدامه على الرسم البياني.
إخلاء المسؤولية
لا يُقصد بالمعلومات والمنشورات أن تكون، أو تشكل، أي نصيحة مالية أو استثمارية أو تجارية أو أنواع أخرى من النصائح أو التوصيات المقدمة أو المعتمدة من TradingView. اقرأ المزيد في شروط الاستخدام.