OPEN-SOURCE SCRIPT
تم تحديثه Ice Cream Volume Profile [Visible range]
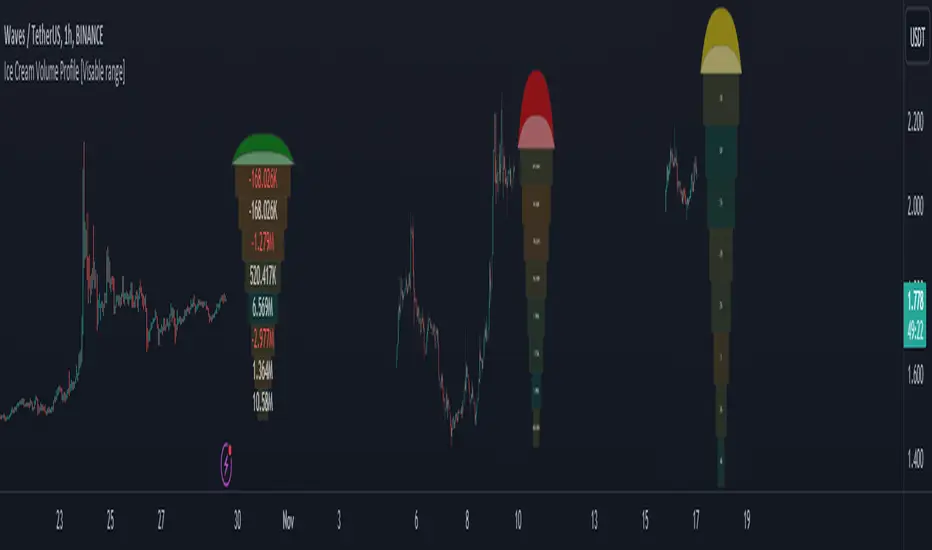
While exploring the new Pine Script feature, Polylines, I've created a fun project called the
Ice Cream Volume Profile for the visible range.
This fun project serves several purposes:
The top part of the ice cream cone changes color as follows:
Polylines are an excellent feature that enables us to create even more intriguing visuals in Pine Script.
Ice Cream Volume Profile for the visible range.
This fun project serves several purposes:
It displays the level at which the most trades (volume) occur.
It provides Delta volume information.
It counts how many times a bar closed within this level.
It assists in drawing support and resistance zones.
It aids in interpreting volume data.
The top part of the ice cream cone changes color as follows:
- Green: When the bullish volume exceeds 55% of the total volume.
- Red: When the bearish volume surpasses 55% of the total volume.
- Yellow: When neither Green nor Red exceeds 55% of the total volume.
Polylines are an excellent feature that enables us to create even more intriguing visuals in Pine Script.
ملاحظات الأخبار
Minor name changeنص برمجي مفتوح المصدر
بروح TradingView الحقيقية، قام مبتكر هذا النص البرمجي بجعله مفتوح المصدر، بحيث يمكن للمتداولين مراجعة وظائفه والتحقق منها. شكرا للمؤلف! بينما يمكنك استخدامه مجانًا، تذكر أن إعادة نشر الكود يخضع لقواعد الموقع الخاصة بنا.
Links : linktr.ee/tzacks
إخلاء المسؤولية
لا يُقصد بالمعلومات والمنشورات أن تكون، أو تشكل، أي نصيحة مالية أو استثمارية أو تجارية أو أنواع أخرى من النصائح أو التوصيات المقدمة أو المعتمدة من TradingView. اقرأ المزيد في شروط الاستخدام.
نص برمجي مفتوح المصدر
بروح TradingView الحقيقية، قام مبتكر هذا النص البرمجي بجعله مفتوح المصدر، بحيث يمكن للمتداولين مراجعة وظائفه والتحقق منها. شكرا للمؤلف! بينما يمكنك استخدامه مجانًا، تذكر أن إعادة نشر الكود يخضع لقواعد الموقع الخاصة بنا.
Links : linktr.ee/tzacks
إخلاء المسؤولية
لا يُقصد بالمعلومات والمنشورات أن تكون، أو تشكل، أي نصيحة مالية أو استثمارية أو تجارية أو أنواع أخرى من النصائح أو التوصيات المقدمة أو المعتمدة من TradingView. اقرأ المزيد في شروط الاستخدام.