OPEN-SOURCE SCRIPT
Indicator: MFI or RSI enclosed by Bollinger Bands
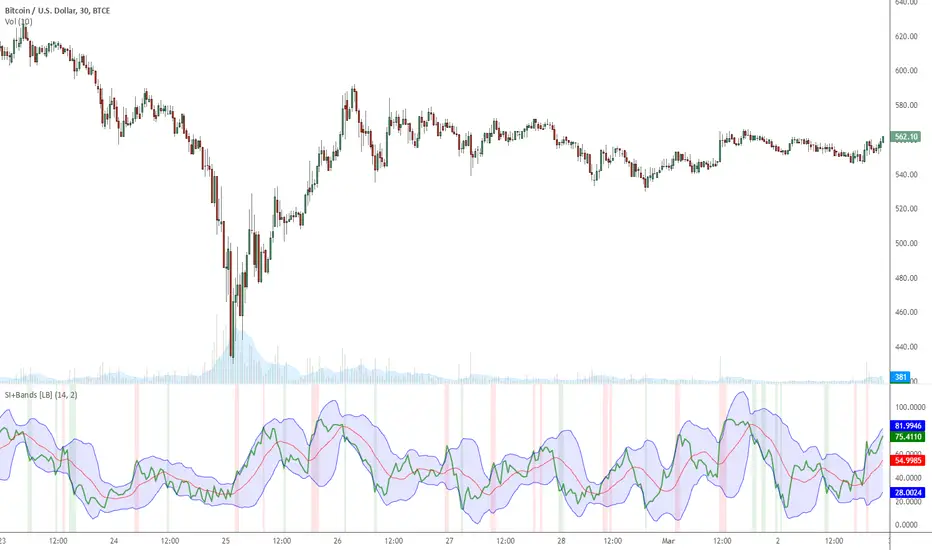
Indicator allows choosing either MFI or RSI and draws a BB over it to identify oversold / overbought conditions.
Oversold/Overbought breaches are highlighted using different colors for easy identification. Has helped me a lot during sudden pumps to identify the tops, hope you find a use for this.
Oversold/Overbought breaches are highlighted using different colors for easy identification. Has helped me a lot during sudden pumps to identify the tops, hope you find a use for this.
نص برمجي مفتوح المصدر
بروح TradingView الحقيقية، قام مبتكر هذا النص البرمجي بجعله مفتوح المصدر، بحيث يمكن للمتداولين مراجعة وظائفه والتحقق منها. شكرا للمؤلف! بينما يمكنك استخدامه مجانًا، تذكر أن إعادة نشر الكود يخضع لقواعد الموقع الخاصة بنا.
List of my free indicators: bit.ly/1LQaPK8
List of my indicators at Appstore: blog.tradingview.com/?p=970
List of my indicators at Appstore: blog.tradingview.com/?p=970
إخلاء المسؤولية
لا يُقصد بالمعلومات والمنشورات أن تكون، أو تشكل، أي نصيحة مالية أو استثمارية أو تجارية أو أنواع أخرى من النصائح أو التوصيات المقدمة أو المعتمدة من TradingView. اقرأ المزيد في شروط الاستخدام.