PROTECTED SOURCE SCRIPT
EMA Standard Deviation | Rocheur
تم تحديثه

Introducing Rocheur’s EMA Standard Deviation Indicator
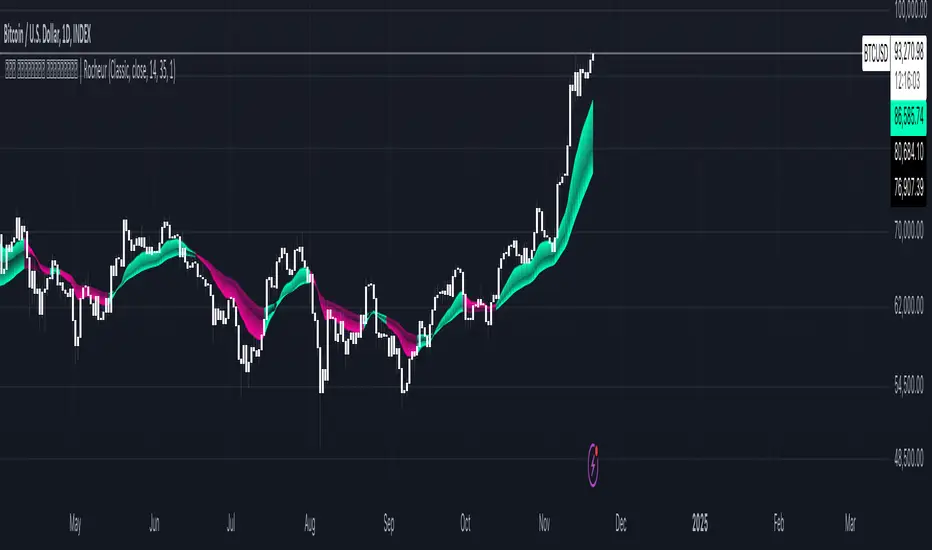
The EMA Standard Deviation indicator is an innovative tool that combines the Exponential Moving Average (EMA) with a standard deviation overlay to highlight potential trading signals. This indicator provides traders with enhanced insight into price deviations, helping to identify possible trend continuations and reversals.
The EMA Standard Deviation indicator is an innovative tool that combines the Exponential Moving Average (EMA) with a standard deviation overlay to highlight potential trading signals. This indicator provides traders with enhanced insight into price deviations, helping to identify possible trend continuations and reversals.
- Understanding the EMA Standard Deviation Concept
The Exponential Moving Average (EMA) is known for its sensitivity to recent price changes, making it a popular choice for trend analysis. By combining the EMA with a standard deviation calculation, this indicator not only tracks price trends but also measures how far prices deviate from their average. This deviation metric helps traders identify overbought or oversold conditions and assess the strength of price movements. - Calculation Logic
The indicator calculates an EMA over a user-defined length and applies a standard deviation over another customizable period. By multiplying the standard deviation by a user-defined factor, thresholds are set for determining potential long and short signals.
Long Signals: A long signal is generated when the price closes above the EMA plus the standard deviation multiplied by the chosen factor.
Short Signals: A short signal occurs when the price closes below the EMA minus the standard deviation multiplied by the chosen factor. - Visual Representation
The EMA Standard Deviation indicator is designed with customizable color options, enabling traders to easily visualize market trends and signals:
Green Bars: Represent a bullish trend when the price is above the EMA and surpasses the positive deviation threshold, indicating a potential long opportunity.
Red Bars: Indicate a bearish trend when the price falls below the EMA and breaches the negative deviation threshold, signaling a potential short opportunity.
Three EMAs of different lengths are plotted to provide a comprehensive view of market behavior:
Primary EMA: Used as the baseline for signal generation.
Filtered EMAs: EMAs calculated over twice and three times the primary length to offer additional context and detect broader trends. - Customization & Parameters
To cater to different trading needs, the EMA Standard Deviation indicator includes several adjustable settings:
EMA Length: Defaulted to 14, controls the main EMA period.
Standard Deviation Length: Set to 35 by default, it determines the period for calculating the deviation.
Multiplier: A factor that adjusts the influence of the standard deviation on signal thresholds.
Color Modes: Multiple visual themes to personalize the appearance of trend signals. - Trading Applications
This indicator is versatile and can be applied across various trading strategies:
Trend Continuation: The combination of EMA and standard deviation helps confirm whether a trend is continuing or weakening.
Reversal Detection: The deviation factor highlights potential reversal points, allowing traders to adjust positions accordingly.
Risk Management: Clearly defined long and short signals assist in making informed entry and exit decisions. - Final Note
The EMA Standard Deviation indicator by Rocheur provides traders with a nuanced view of price movements and deviations, enhancing trend analysis and market decision-making. As with any indicator, backtesting and customization are recommended to align the tool with specific trading strategies. While this tool adds depth to technical analysis, no indicator guarantees success; it should be used as part of a comprehensive trading approach.
ملاحظات الأخبار
Added alert conditionملاحظات الأخبار
Updated to V6ملاحظات الأخبار
Updated UIنص برمجي محمي
تم نشر هذا النص البرمجي بمصدر غير مفتوح ويمكنك استخدامه بحرية. يمكنك جعله مفضلاً لاستخدامه على الرسم البياني. لا يمكنك مشاهدة أو تعديل كود المصدر الخاص به.
هل تريد استخدام هذا النص البرمجي على الرسم البياني؟
إخلاء المسؤولية
لا يُقصد بالمعلومات والمنشورات أن تكون، أو تشكل، أي نصيحة مالية أو استثمارية أو تجارية أو أنواع أخرى من النصائح أو التوصيات المقدمة أو المعتمدة من TradingView. اقرأ المزيد في شروط الاستخدام.