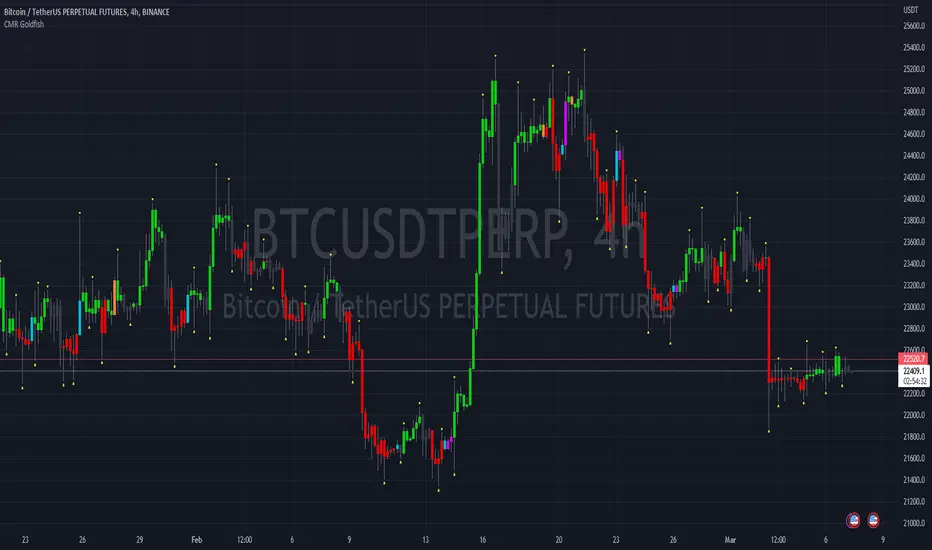
CMR Goldfish

Looking at multiple timeframes the indicator gives insight into witch direction the market is moving and helps indicate good entry and exit points.
The indicator works on all timeframes and markets. Within the setting the Indicator can be fine tuned to the market you are watching.
The Indicator paints the candles. You need to either hide the regular candles or bring the indicators visual order to the front.
Goldfish Indicator Overview
Green = bullish
Red = bearish
Black = neutral
Purple = hedged, this means we have bullish and bearish
Blue = hedged, with possible long entry
Orange = hedged with possible short entry
Trade
Enter a Long trade on a blue or first geen candle
Enter a Short on an orange or first red candle
Hedge in pink
No trades on black
نص برمجي للمستخدمين المدعوين فقط
يمكن فقط للمستخدمين الذين تمت الموافقة عليهم من قبل المؤلف الوصول إلى هذا البرنامج النصي. ستحتاج إلى طلب الإذن والحصول عليه لاستخدامه. يتم منح هذا عادةً بعد الدفع. لمزيد من التفاصيل، اتبع تعليمات المؤلف أدناه أو اتصل IDSalgo مباشرة.
تجدر الإشارة إلى أن هذا النص البرمجي الخاص والموجه بدعوة فقط لم تتم مراجعته من قبل المشرفين على النص البرمجي، كما أن امتثاله للقواعد الداخلية غير محدد. لا توصي TradingView بالدفع مقابل برنامج نصي أو استخدامه إلا إذا كنت تثق تمامًا في مؤلفه وتفهم كيفية عمله. يمكنك أيضًا العثور على بدائل مجانية ومفتوحة المصدر في نصوص مجتمعنا.
تعليمات المؤلف
إخلاء المسؤولية
نص برمجي للمستخدمين المدعوين فقط
يمكن فقط للمستخدمين الذين تمت الموافقة عليهم من قبل المؤلف الوصول إلى هذا البرنامج النصي. ستحتاج إلى طلب الإذن والحصول عليه لاستخدامه. يتم منح هذا عادةً بعد الدفع. لمزيد من التفاصيل، اتبع تعليمات المؤلف أدناه أو اتصل IDSalgo مباشرة.
تجدر الإشارة إلى أن هذا النص البرمجي الخاص والموجه بدعوة فقط لم تتم مراجعته من قبل المشرفين على النص البرمجي، كما أن امتثاله للقواعد الداخلية غير محدد. لا توصي TradingView بالدفع مقابل برنامج نصي أو استخدامه إلا إذا كنت تثق تمامًا في مؤلفه وتفهم كيفية عمله. يمكنك أيضًا العثور على بدائل مجانية ومفتوحة المصدر في نصوص مجتمعنا.