PROTECTED SOURCE SCRIPT
تم تحديثه BTC Market Top and Bottom
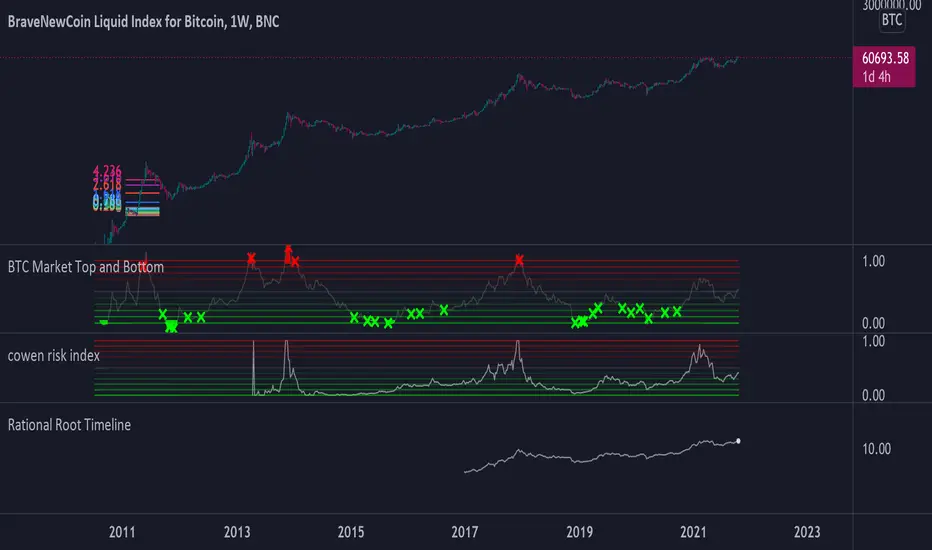
This script is a logarithmic moving average oscillator for the daily BTC chart (Or any asset ideally with data more than 4 years in length) to help find the top and bottom of the entire cycle. The idea is to buy when the oscillator is near green and sell when things are near the red. Should be used in conjunction with shorter timeframe indicators to find your best entries. This just shows the overall position of the cycle.
Instructions:
Use on a Daily BTCUSD chart or BLX chart. The more data the better.
Adjust the length to around 1000-1500 (this mainly controls the green line)
Adjust the denominator (this mainly controls the red line)
Adjust the smoothness (for visual appeal and noise reduction)
Instructions:
Use on a Daily BTCUSD chart or BLX chart. The more data the better.
Adjust the length to around 1000-1500 (this mainly controls the green line)
Adjust the denominator (this mainly controls the red line)
Adjust the smoothness (for visual appeal and noise reduction)
ملاحظات الأخبار
Converted to security function to show Daily on all timeframes. Changed signal line to a function to allow for an incrementing sma inside the security function. ملاحظات الأخبار
Added a momentum function to the signal. This should help spot when the momentum is potentially reversing when the signal is higher than momentum top and less than momentum bottom. You can adjust them in the settings.ملاحظات الأخبار
Added risk levelsنص برمجي محمي
تم نشر هذا النص البرمجي كمصدر مغلق. ومع ذلك، يمكنك استخدامه بحرية ودون أي قيود - تعرف على المزيد هنا.
إخلاء المسؤولية
لا يُقصد بالمعلومات والمنشورات أن تكون، أو تشكل، أي نصيحة مالية أو استثمارية أو تجارية أو أنواع أخرى من النصائح أو التوصيات المقدمة أو المعتمدة من TradingView. اقرأ المزيد في شروط الاستخدام.
نص برمجي محمي
تم نشر هذا النص البرمجي كمصدر مغلق. ومع ذلك، يمكنك استخدامه بحرية ودون أي قيود - تعرف على المزيد هنا.
إخلاء المسؤولية
لا يُقصد بالمعلومات والمنشورات أن تكون، أو تشكل، أي نصيحة مالية أو استثمارية أو تجارية أو أنواع أخرى من النصائح أو التوصيات المقدمة أو المعتمدة من TradingView. اقرأ المزيد في شروط الاستخدام.