PROTECTED SOURCE SCRIPT
تم تحديثه N day Anchored Rolling VWAP
⭐Overview
The N-Day Anchored Rolling VWAP is designed to automate and simplify the use of anchored VWAP for traders, making it an invaluable tool for those who rely on VWAP for trend filtering, support/resistance identification, or strategy implementation. This indicator removes the tedious and repetitive manual process of setting the anchored VWAP for multiple charts or stocks in a watchlist. Once added, the indicator dynamically maintains and updates the anchor point across charts, allowing users to focus on their analysis instead of time-consuming adjustments.
________________________________________
⭐Goal of the Indicator
The primary goal of this indicator is to automate the manual process of anchoring the VWAP for multiple charts or stocks. By removing the need to manually set the anchor every day, this script simplifies the workflow and saves valuable time for traders.
The examples and chart illustrations provided showcases some of the most common and widely used ways traders utilize anchored VWAP in their strategies. They are intended as demonstrations, not exhaustive applications, as specific use cases may vary based on individual trading approaches.
________________________________________
⭐Why the Name?
1).N-Day Anchored:
The term "N-Day Anchored" reflects the flexibility of the anchor point. Users can specify the number of days prior to the present day where the VWAP calculation should begin. For
example:
🟢"0" anchors the VWAP to the current day's opening.
🟢"1" anchor it to the previous day's opening.
🟢"2" anchors it to the day before yesterday, and so on.
2).Rolling:
The "Rolling" aspect signifies that the anchor point remains consistent relative to the current day. For instance:
If the anchor is set to the day before yesterday, the indicator will continuously adjust to
ensure the anchor remains two days prior, even as new trading days begin. This means the
lines plotted always reflect the VWAP anchored to the chosen
relative day, regardless of how many days have passed.
________________________________________
⭐Inputs, Settings, and Functionality
1).Anchor Point (Days Prior): Use the "Days prior" input to set the anchor point for VWAP:
🟢"0": Anchors the VWAP to the start of the current day's trading session.
🟢"1": (default): Anchors the VWAP to the start of the previous day's trading session.
🟢"2": Anchors the VWAP to the day before yesterday, and so on.
This input determines the starting point for the VWAP calculation and updates dynamically each day.
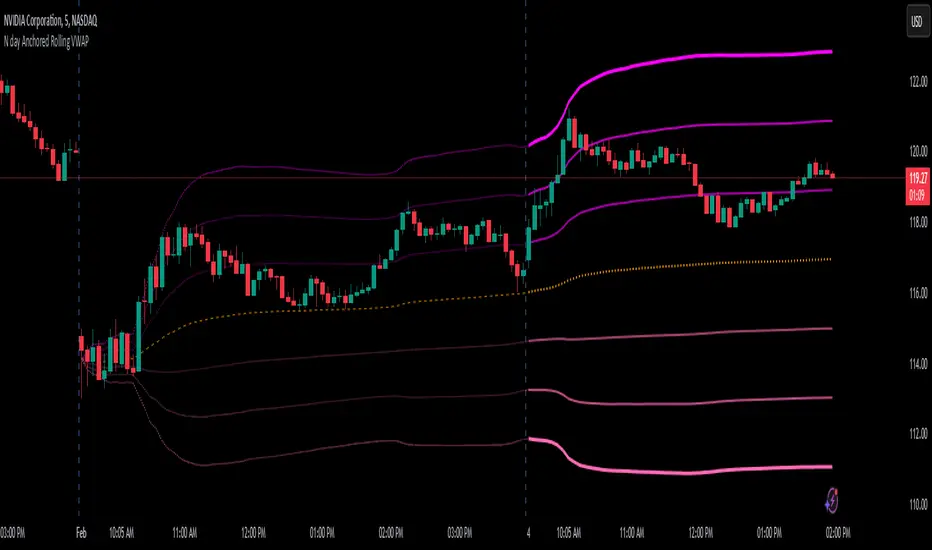
2).VWAP Line Customization: The orange dashed line represents the anchored VWAP.
You can adjust its color through the input’s menu.
3).Standard Deviation Bands:
⭕Three Bands: The indicator plots three upper and three lower bands to represent standard deviation levels from the VWAP.
➡️On the current day, these bands are plotted as thick, solid lines with bright colors, providing clear real-time plotting.
➡️On historical days, the bands appear as faint, dotted lines, offering a visual
representation of the anchored VWAP without cluttering the chart.
⭕Customizable Settings:
➡️Multiplier: Set the distance of each band from the VWAP.
➡️Colors: Choose separate colors for the upper and lower bands.
➡️Visibility Toggle: Enable or disable specific bands as needed.
This clear differentiation ensures traders can easily distinguish between real-time plotting (current day) and the visualization of historical anchoring.
________________________________________
⭐Example Use Cases
1).Trend Filter: Use the anchored VWAP as a trend filter:
➡️When the price is above the anchored VWAP, the trend is bullish.
➡️When the price is below the anchored VWAP, the trend is bearish.
2).2-Day Anchored VWAP Strategy: This strategy uses the VWAP anchored to the
previous day’s opening candle, continuing through today’s price action. Traders can
identify entry and exit points based on how the price interacts with this 2-day anchored VWAP.
3).Standard Deviation Bands as Support or Resistance: Utilize the standard deviation
bands to find potential support and resistance levels, as prices often react near these
bands.
4).VWAP Rejection (VWAP Bounce): Look for rejections near the anchored VWAP to
confirm a continuation of the current trend. For example, if the price rejects the 2-day
anchored VWAP, it can signal a strong continuation in the current trend direction.
ملاحظات الأخبار
Added Input options to change the "Line Style" and "Line Width".نص برمجي محمي
تم نشر هذا النص البرمجي كمصدر مغلق. ومع ذلك، يمكنك استخدامه بحرية ودون أي قيود - تعرف على المزيد هنا.
إخلاء المسؤولية
لا يُقصد بالمعلومات والمنشورات أن تكون، أو تشكل، أي نصيحة مالية أو استثمارية أو تجارية أو أنواع أخرى من النصائح أو التوصيات المقدمة أو المعتمدة من TradingView. اقرأ المزيد في شروط الاستخدام.
نص برمجي محمي
تم نشر هذا النص البرمجي كمصدر مغلق. ومع ذلك، يمكنك استخدامه بحرية ودون أي قيود - تعرف على المزيد هنا.
إخلاء المسؤولية
لا يُقصد بالمعلومات والمنشورات أن تكون، أو تشكل، أي نصيحة مالية أو استثمارية أو تجارية أو أنواع أخرى من النصائح أو التوصيات المقدمة أو المعتمدة من TradingView. اقرأ المزيد في شروط الاستخدام.