PINE LIBRARY
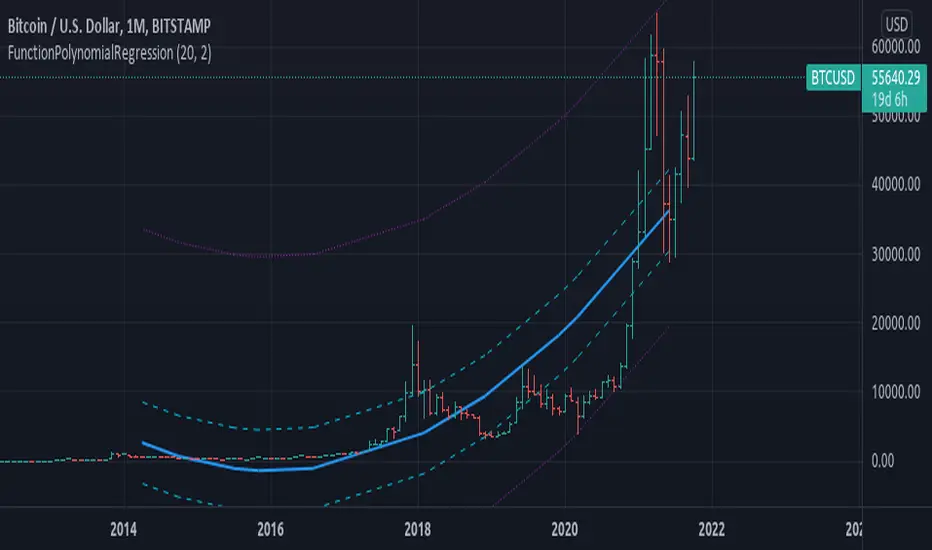
FunctionPolynomialRegression

Library "FunctionPolynomialRegression"
TODO:
polyreg(sample_x, sample_y) Method to return a polynomial regression channel using (X,Y) sample points.
Parameters:
sample_x: float array, sample data X points.
sample_y: float array, sample data Y points.
Returns: tuple with:
_predictions: Array with adjusted Y values.
_max_dev: Max deviation from the mean.
_min_dev: Min deviation from the mean.
_stdev/_sizeX: Average deviation from the mean.
draw(sample_x, sample_y, extend, mid_color, mid_style, mid_width, std_color, std_style, std_width, max_color, max_style, max_width) Method for drawing the Polynomial Regression into chart.
Parameters:
sample_x: float array, sample point X value.
sample_y: float array, sample point Y value.
extend: string, default=extend.none, extend lines.
mid_color: color, default=color.blue, middle line color.
mid_style: string, default=line.style_solid, middle line style.
mid_width: int, default=2, middle line width.
std_color: color, default=color.aqua, standard deviation line color.
std_style: string, default=line.style_dashed, standard deviation line style.
std_width: int, default=1, standard deviation line width.
max_color: color, default=color.purple, max range line color.
max_style: string, default=line.style_dotted, max line style.
max_width: int, default=1, max line width.
Returns: line array.
مكتبة باين
كمثال للقيم التي تتبناها TradingView، نشر المؤلف شيفرة باين كمكتبة مفتوحة المصدر بحيث يمكن لمبرمجي باين الآخرين من مجتمعنا استخدامه بحرية. تحياتنا للمؤلف! يمكنك استخدام هذه المكتبة بشكل خاص أو في منشورات أخرى مفتوحة المصدر، ولكن إعادة استخدام هذا الرمز في المنشورات تخضع لقواعد الموقع.
إخلاء المسؤولية
لا يُقصد بالمعلومات والمنشورات أن تكون، أو تشكل، أي نصيحة مالية أو استثمارية أو تجارية أو أنواع أخرى من النصائح أو التوصيات المقدمة أو المعتمدة من TradingView. اقرأ المزيد في شروط الاستخدام.