PROTECTED SOURCE SCRIPT
Enhanced Pump and Dump Indicator by TGK
The "Enhanced Pump and Dump Indicator and TGK" is a sophisticated technical analysis tool designed to assist traders in identifying potential pump and dump scenarios within the markets. This indicator uses a combination of price movement, volume analysis, and relative strength index (RSI) to provide actionable signals for traders.
Key Features:
1. Price Change Detection: The indicator calculates the percentage change in the price between the current and previous candles to identify significant price movements.
2. Volume Analysis: It detects volume spikes by comparing current volume against the average volume over a defined period to confirm the strength of a price movement.
3. RSI Overview: The Relative Strength Index (RSI) is employed to determine overbought and oversold conditions, helping traders avoid entering trades at unfavorable times.
4. Moving Averages: Short-term and long-term Simple Moving Averages (SMAs) are utilized to identify bullish and bearish trends.
5. Support and Resistance Levels: The indicator calculates key support and resistance levels that are crucial for making informed trading decisions.
How to Use:
1. Install the Indicator: Add the "Enhanced Pump and Dump Indicator and TGK" to your chart from the Indicators menu on TradingView.
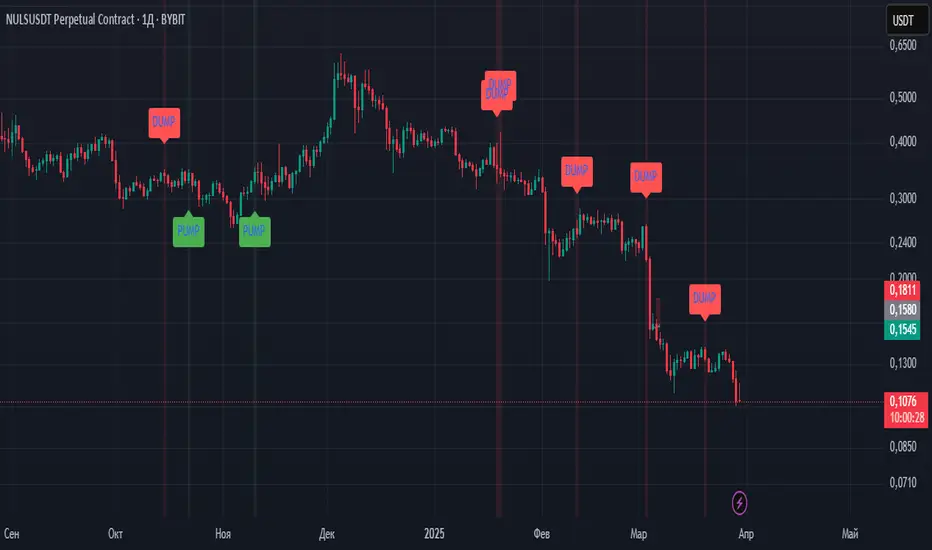
2. Identify Pump Signals:
- Look for a green background on the chart, which indicates a potential pump.
- The indicator generates a "PUMP" label below the price bar when the following conditions are met:
- The price change is greater than the specified threshold (e.g., 1%).
- There is a volume spike (current volume > average volume * volume multiplier).
- A bullish trend is confirmed (short SMA > long SMA).
- The RSI is not in the overbought zone (RSI < 70).
- The closing price is below the resistance level.
3. Identify Dump Signals:
- Look for a red background on the chart, indicating a potential dump.
- The indicator generates a "DUMP" label above the price bar when the following conditions are satisfied:
- The price change is less than the negative threshold (e.g., -1%).
- A volume spike is detected.
- A bearish trend is confirmed (short SMA < long SMA).
- The RSI is not in the oversold zone (RSI > 30).
- The closing price is above the support level.
4. Set Up Alerts:
- Utilize the built-in alerts feature to receive notifications for pump and dump signals.
- Alerts can be configured to notify you when pump or dump conditions are met, allowing you to take timely action.
Best Practices:
- Use this indicator in conjunction with other technical analysis tools or fundamental analysis to increase the accuracy of your trading decisions.
- Consider the overall market context and news events that may impact price movements.
- Always employ risk management strategies, such as setting stop-loss orders and diversifying your portfolio.
Disclaimer:
This indicator is intended for educational and informational purposes only and should not be considered financial advice. Trading involves risks, and you should conduct thorough research and analysis before making any trading decisions.
Key Features:
1. Price Change Detection: The indicator calculates the percentage change in the price between the current and previous candles to identify significant price movements.
2. Volume Analysis: It detects volume spikes by comparing current volume against the average volume over a defined period to confirm the strength of a price movement.
3. RSI Overview: The Relative Strength Index (RSI) is employed to determine overbought and oversold conditions, helping traders avoid entering trades at unfavorable times.
4. Moving Averages: Short-term and long-term Simple Moving Averages (SMAs) are utilized to identify bullish and bearish trends.
5. Support and Resistance Levels: The indicator calculates key support and resistance levels that are crucial for making informed trading decisions.
How to Use:
1. Install the Indicator: Add the "Enhanced Pump and Dump Indicator and TGK" to your chart from the Indicators menu on TradingView.
2. Identify Pump Signals:
- Look for a green background on the chart, which indicates a potential pump.
- The indicator generates a "PUMP" label below the price bar when the following conditions are met:
- The price change is greater than the specified threshold (e.g., 1%).
- There is a volume spike (current volume > average volume * volume multiplier).
- A bullish trend is confirmed (short SMA > long SMA).
- The RSI is not in the overbought zone (RSI < 70).
- The closing price is below the resistance level.
3. Identify Dump Signals:
- Look for a red background on the chart, indicating a potential dump.
- The indicator generates a "DUMP" label above the price bar when the following conditions are satisfied:
- The price change is less than the negative threshold (e.g., -1%).
- A volume spike is detected.
- A bearish trend is confirmed (short SMA < long SMA).
- The RSI is not in the oversold zone (RSI > 30).
- The closing price is above the support level.
4. Set Up Alerts:
- Utilize the built-in alerts feature to receive notifications for pump and dump signals.
- Alerts can be configured to notify you when pump or dump conditions are met, allowing you to take timely action.
Best Practices:
- Use this indicator in conjunction with other technical analysis tools or fundamental analysis to increase the accuracy of your trading decisions.
- Consider the overall market context and news events that may impact price movements.
- Always employ risk management strategies, such as setting stop-loss orders and diversifying your portfolio.
Disclaimer:
This indicator is intended for educational and informational purposes only and should not be considered financial advice. Trading involves risks, and you should conduct thorough research and analysis before making any trading decisions.
نص برمجي محمي
تم نشر هذا النص البرمجي كمصدر مغلق. ومع ذلك، يمكنك استخدامه بحرية ودون أي قيود - تعرف على المزيد هنا.
إخلاء المسؤولية
لا يُقصد بالمعلومات والمنشورات أن تكون، أو تشكل، أي نصيحة مالية أو استثمارية أو تجارية أو أنواع أخرى من النصائح أو التوصيات المقدمة أو المعتمدة من TradingView. اقرأ المزيد في شروط الاستخدام.