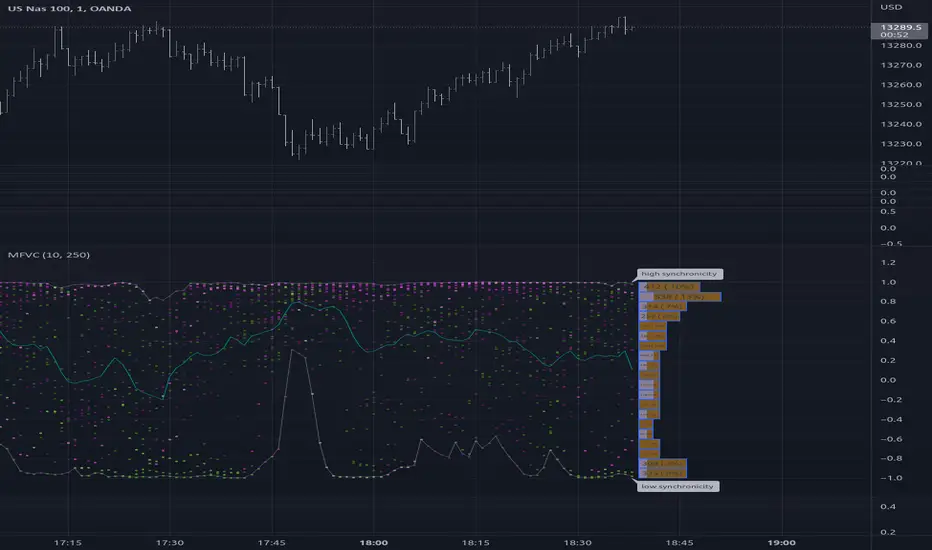
This is a complex indicator that looks to provide some insight into the correlation between volume and price volatility.
Rising volatility is depicted with the color green while falling volatility is depicted with purple.
Lightness of the color is used to depict the length of the window used, darker == shorter in the 2 -> 512 window range.
Rising volatility is depicted with the color green while falling volatility is depicted with purple.
Lightness of the color is used to depict the length of the window used, darker == shorter in the 2 -> 512 window range.
ملاحظات الأخبار
added a histogram to show last and recent(10 bars) distribution of correlationملاحظات الأخبار
updated histogram calculation, it now allows the input length of the aggregation of values, added values display on histogram bars.ملاحظات الأخبار
added labels with some description.نص برمجي مفتوح المصدر
بروح TradingView الحقيقية، قام مبتكر هذا النص البرمجي بجعله مفتوح المصدر، بحيث يمكن للمتداولين مراجعة وظائفه والتحقق منها. شكرا للمؤلف! بينما يمكنك استخدامه مجانًا، تذكر أن إعادة نشر الكود يخضع لقواعد الموقع الخاصة بنا.
إخلاء المسؤولية
لا يُقصد بالمعلومات والمنشورات أن تكون، أو تشكل، أي نصيحة مالية أو استثمارية أو تجارية أو أنواع أخرى من النصائح أو التوصيات المقدمة أو المعتمدة من TradingView. اقرأ المزيد في شروط الاستخدام.
نص برمجي مفتوح المصدر
بروح TradingView الحقيقية، قام مبتكر هذا النص البرمجي بجعله مفتوح المصدر، بحيث يمكن للمتداولين مراجعة وظائفه والتحقق منها. شكرا للمؤلف! بينما يمكنك استخدامه مجانًا، تذكر أن إعادة نشر الكود يخضع لقواعد الموقع الخاصة بنا.
إخلاء المسؤولية
لا يُقصد بالمعلومات والمنشورات أن تكون، أو تشكل، أي نصيحة مالية أو استثمارية أو تجارية أو أنواع أخرى من النصائح أو التوصيات المقدمة أو المعتمدة من TradingView. اقرأ المزيد في شروط الاستخدام.