OPEN-SOURCE SCRIPT
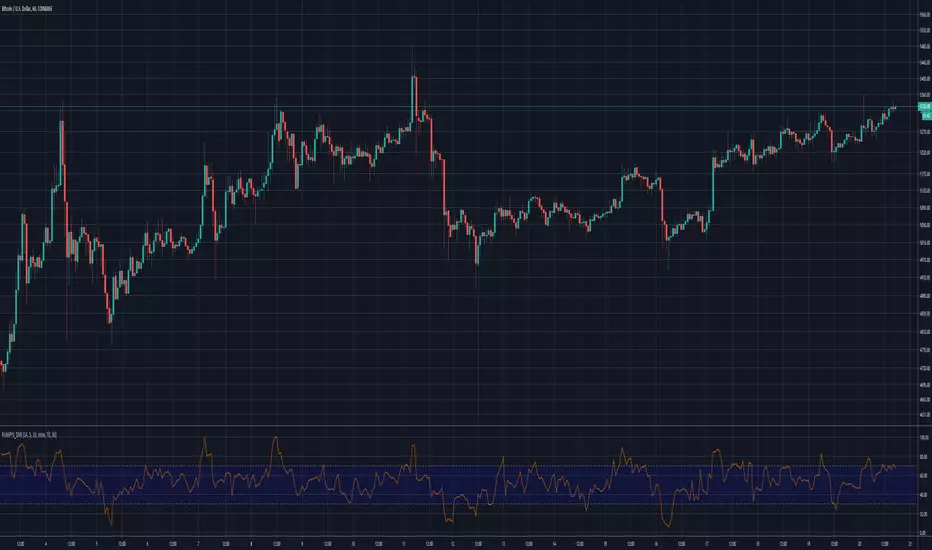
Rumpy's Dynamic Momentum Index
Note : I haven't been able to determine from the info I've found whether the variable length is used for the average gain/loss part of the calculation and/or for the relative strength portion of the calculation . If anyone knows for certain please let me know.
Type A only uses the variable length for the final relative strength calculation and the fixed RSI length for the average gain/loss.
Type B uses the variable length for both.
I do suspect that Type B is correct though as it is a lot more sensitive to momentum changes while Type A tends to just exaggerate normal RSI
-------------------------------------------------------------------------------------------------------------------------------------------
This indicator, developed by Tushar Chande and Stanley Kroll, is similar to the relative strength index (RSI). The main difference between the two is that the RSI uses a fixed number of time periods (usually 14) in its calculation, while the dynamic momentum index uses different time periods as volatility changes, typically between five and 30.
The dynamic momentum index uses fewer periods in its calculation when volatility is high, and more periods when volatility is low.
The number of time periods used in the dynamic momentum index decreases as volatility in the underlying security increases, making this indicator more responsive to changing prices than the RSI. This is particularly useful when an asset's price moves quickly as it approaches key support or resistance levels. Because the indicator is more sensitive, traders can potentially find earlier entry and exit points than with the RSI.
-------------------------------------------------------------------------------------------------------------------------------------------
If you find it useful please consider a tip/donation :
BTC - 3BMEXEDyWJ58eXUEALYPadbn1wwWKmf6sA
نص برمجي مفتوح المصدر
بروح TradingView الحقيقية، قام مبتكر هذا النص البرمجي بجعله مفتوح المصدر، بحيث يمكن للمتداولين مراجعة وظائفه والتحقق منها. شكرا للمؤلف! بينما يمكنك استخدامه مجانًا، تذكر أن إعادة نشر الكود يخضع لقواعد الموقع الخاصة بنا.
إخلاء المسؤولية
لا يُقصد بالمعلومات والمنشورات أن تكون، أو تشكل، أي نصيحة مالية أو استثمارية أو تجارية أو أنواع أخرى من النصائح أو التوصيات المقدمة أو المعتمدة من TradingView. اقرأ المزيد في شروط الاستخدام.