OPEN-SOURCE SCRIPT
Indiq 2.0
The functionality of the indicator includes the following features:
Moving Averages (MA):
The ability to adjust periods for short (short_ma_length) and long (long_ma_length) moving averages.
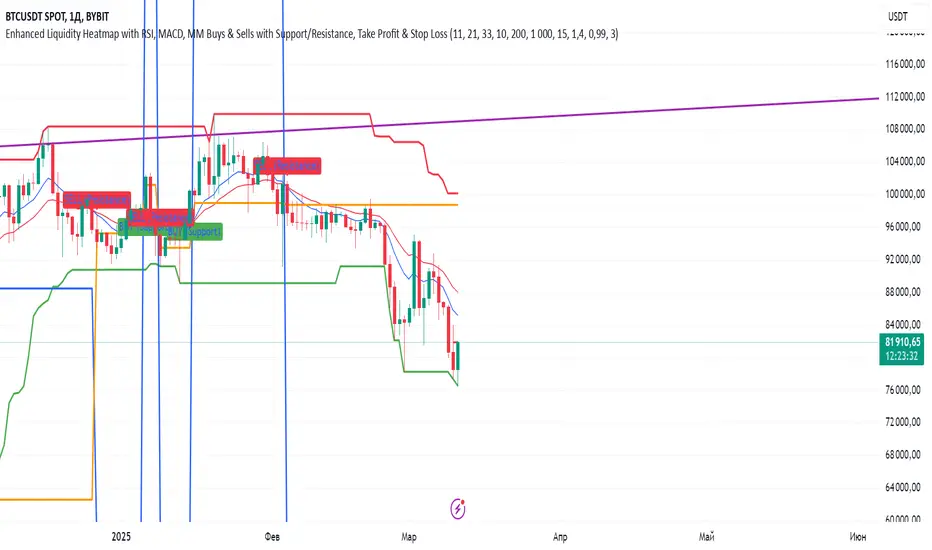
Display of moving averages on the chart:
Short MA (blue line).
Long MA (red line).
Generation of buy and sell signals:
Buy (BUY): When the short MA crosses the long MA from below.
Sell (SELL): When the short MA crosses the long MA from above.
Visualization of signals on the chart:
Buy is displayed as a green BUY marker below the candle.
Sell is displayed as a red SELL marker above the candle.
Liquidity Heatmap:
Liquidity levels:
Levels are calculated based on the closing price and a step (liquidity_step).
Levels are grouped by the nearest price values.
Volumes at levels:
Volume (volume) is accumulated for each liquidity level.
Levels with a volume less than min_volume_filter are not displayed.
Time filtering:
Levels that have not been updated within the last time_filter bars are not displayed.
Volatility filtering:
Levels are filtered by volatility (ATR) to exclude those outside the volatility range.
Color gradient:
The color of levels depends on volume (gradient from gradient_start_color to gradient_end_color).
Visualization:
Liquidity levels are displayed as horizontal lines.
Volumes at levels are shown as text labels.
RSI Filtering:
The ability to enable/disable RSI filtering (rsi_filter).
Liquidity levels are filtered based on overbought (rsi_overbought) and oversold (rsi_oversold) conditions.
Levels that do not meet RSI conditions are not displayed.
MACD Filtering:
The ability to enable/disable MACD filtering (macd_filter).
Liquidity levels are filtered based on the MACD histogram condition (e.g., only if the histogram is above zero).
Levels that do not meet MACD conditions are not displayed.
Display of Market Maker Buys:
Condition for market maker buys:
Volume exceeds the average volume over the last 20 bars by 2 times.
Closing price is above the opening price.
Market maker buys are displayed on the chart as orange MM Buy markers below the candle.
Indicator Settings:
Moving average parameters:
short_ma_length: Period for the short MA.
long_ma_length: Period for the long MA.
Liquidity heatmap parameters:
liquidity_step: Step between liquidity levels.
max_levels: Maximum number of levels to display.
time_filter: Time filter (last N bars).
min_volume_filter: Minimum volume for displaying a level.
volatility_filter: Volatility filter (ATR multiplier).
RSI parameters:
rsi_filter: Enable/disable RSI filtering.
rsi_overbought: Overbought RSI level.
rsi_oversold: Oversold RSI level.
MACD parameters:
macd_filter: Enable/disable MACD filtering.
Color settings:
gradient_start_color: Starting color of the gradient.
gradient_end_color: Ending color of the gradient.
Visualization:
Moving averages:
Short MA: Blue line.
Long MA: Red line.
Signals:
Buy: Green BUY marker.
Sell: Red SELL marker.
Liquidity heatmap:
Liquidity levels: Horizontal lines with a color gradient.
Volumes: Text labels at levels.
Market maker buys:
Orange MM Buy markers.
Alerts:
The ability to set alerts for signals:
Buy (BUY).
Sell (SELL).
Additional Features:
Flexible filter settings:
Filtering by time, volume, volatility, RSI, and MACD.
Extensibility:
The ability to add new filters (e.g., Stochastic, Volume Profile, etc.).
Visual customization:
Adjustment of colors, sizes, and display styles.
Summary:
The indicator provides a comprehensive tool for analyzing liquidity, generating trading signals, and tracking market maker activity. It combines:
A liquidity heatmap.
Signals based on moving averages.
Filtering by RSI and MACD.
Display of market maker buys.
Flexible settings and visualization.
This indicator is suitable for traders who want to analyze liquidity levels, identify entry and exit points, and monitor the actions of large market players.
Moving Averages (MA):
The ability to adjust periods for short (short_ma_length) and long (long_ma_length) moving averages.
Display of moving averages on the chart:
Short MA (blue line).
Long MA (red line).
Generation of buy and sell signals:
Buy (BUY): When the short MA crosses the long MA from below.
Sell (SELL): When the short MA crosses the long MA from above.
Visualization of signals on the chart:
Buy is displayed as a green BUY marker below the candle.
Sell is displayed as a red SELL marker above the candle.
Liquidity Heatmap:
Liquidity levels:
Levels are calculated based on the closing price and a step (liquidity_step).
Levels are grouped by the nearest price values.
Volumes at levels:
Volume (volume) is accumulated for each liquidity level.
Levels with a volume less than min_volume_filter are not displayed.
Time filtering:
Levels that have not been updated within the last time_filter bars are not displayed.
Volatility filtering:
Levels are filtered by volatility (ATR) to exclude those outside the volatility range.
Color gradient:
The color of levels depends on volume (gradient from gradient_start_color to gradient_end_color).
Visualization:
Liquidity levels are displayed as horizontal lines.
Volumes at levels are shown as text labels.
RSI Filtering:
The ability to enable/disable RSI filtering (rsi_filter).
Liquidity levels are filtered based on overbought (rsi_overbought) and oversold (rsi_oversold) conditions.
Levels that do not meet RSI conditions are not displayed.
MACD Filtering:
The ability to enable/disable MACD filtering (macd_filter).
Liquidity levels are filtered based on the MACD histogram condition (e.g., only if the histogram is above zero).
Levels that do not meet MACD conditions are not displayed.
Display of Market Maker Buys:
Condition for market maker buys:
Volume exceeds the average volume over the last 20 bars by 2 times.
Closing price is above the opening price.
Market maker buys are displayed on the chart as orange MM Buy markers below the candle.
Indicator Settings:
Moving average parameters:
short_ma_length: Period for the short MA.
long_ma_length: Period for the long MA.
Liquidity heatmap parameters:
liquidity_step: Step between liquidity levels.
max_levels: Maximum number of levels to display.
time_filter: Time filter (last N bars).
min_volume_filter: Minimum volume for displaying a level.
volatility_filter: Volatility filter (ATR multiplier).
RSI parameters:
rsi_filter: Enable/disable RSI filtering.
rsi_overbought: Overbought RSI level.
rsi_oversold: Oversold RSI level.
MACD parameters:
macd_filter: Enable/disable MACD filtering.
Color settings:
gradient_start_color: Starting color of the gradient.
gradient_end_color: Ending color of the gradient.
Visualization:
Moving averages:
Short MA: Blue line.
Long MA: Red line.
Signals:
Buy: Green BUY marker.
Sell: Red SELL marker.
Liquidity heatmap:
Liquidity levels: Horizontal lines with a color gradient.
Volumes: Text labels at levels.
Market maker buys:
Orange MM Buy markers.
Alerts:
The ability to set alerts for signals:
Buy (BUY).
Sell (SELL).
Additional Features:
Flexible filter settings:
Filtering by time, volume, volatility, RSI, and MACD.
Extensibility:
The ability to add new filters (e.g., Stochastic, Volume Profile, etc.).
Visual customization:
Adjustment of colors, sizes, and display styles.
Summary:
The indicator provides a comprehensive tool for analyzing liquidity, generating trading signals, and tracking market maker activity. It combines:
A liquidity heatmap.
Signals based on moving averages.
Filtering by RSI and MACD.
Display of market maker buys.
Flexible settings and visualization.
This indicator is suitable for traders who want to analyze liquidity levels, identify entry and exit points, and monitor the actions of large market players.
نص برمجي مفتوح المصدر
بروح TradingView الحقيقية، قام مبتكر هذا النص البرمجي بجعله مفتوح المصدر، بحيث يمكن للمتداولين مراجعة وظائفه والتحقق منها. شكرا للمؤلف! بينما يمكنك استخدامه مجانًا، تذكر أن إعادة نشر الكود يخضع لقواعد الموقع الخاصة بنا.
إخلاء المسؤولية
لا يُقصد بالمعلومات والمنشورات أن تكون، أو تشكل، أي نصيحة مالية أو استثمارية أو تجارية أو أنواع أخرى من النصائح أو التوصيات المقدمة أو المعتمدة من TradingView. اقرأ المزيد في شروط الاستخدام.