PROTECTED SOURCE SCRIPT
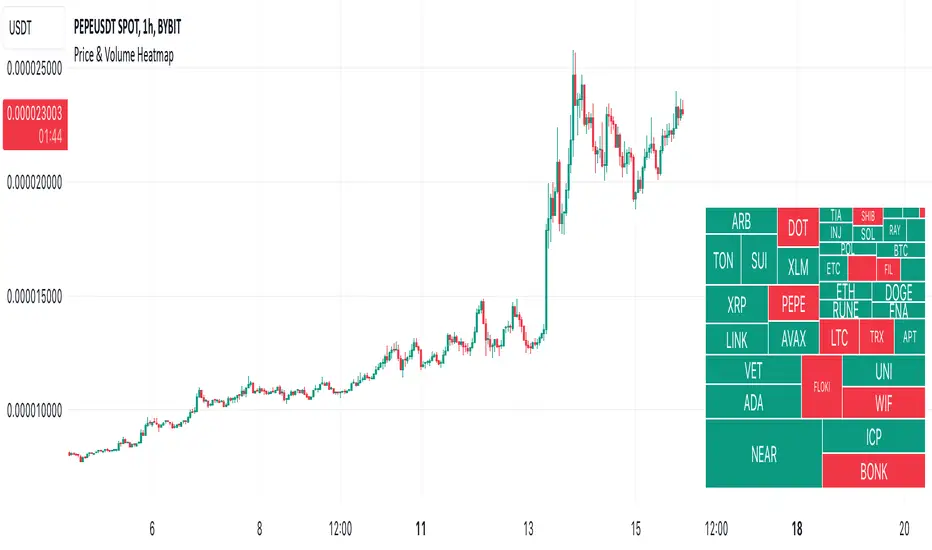
Price & Volume Heatmap

Description:
Displays a heatmap (like TV's Stock Heatmap) for up to 40 symbols (either from 3 presets, or custom). It can show Price Change, Volume Change and Volume (in $). The text size for each symbol can auto-change based on whether it fits into the cell. Each cell shows the name of the symbol, and when hovered - it shows the value.
Inputs:
- Symbols -> which symbols to use (Custom, or predefined list of Stocks/Crypto/Forex)
- Data -> show Price Change (%), Volume Change (%) or Volume ($)
- Custom -> put your custom list of symbols here (comma separated without spaces, up to 40 symbols)
- Position -> heatmap position
- Height / Width -> height / width of the heatmap (% of indicator's space)
- Text Size -> can be constant (Tiny/Normal/etc) or automatically change based on the text of each cell (Auto/Auto (Smaller))
- Color -> text color
Notes:
It is not recommended to use the script on timeframes below 30 seconds, because it may be too slow there (since it's based on a table object, it might be slow).
نص برمجي محمي
تم نشر هذا النص البرمجي كمصدر مغلق. ومع ذلك، يمكنك استخدامه بحرية ودون أي قيود - تعرف على المزيد هنا.
إخلاء المسؤولية
لا يُقصد بالمعلومات والمنشورات أن تكون، أو تشكل، أي نصيحة مالية أو استثمارية أو تجارية أو أنواع أخرى من النصائح أو التوصيات المقدمة أو المعتمدة من TradingView. اقرأ المزيد في شروط الاستخدام.