PROTECTED SOURCE SCRIPT
Volume-Weighted Support and Resistance with Projections
Volume-Weighted Support and Resistance with Projections (VW-SRP)
Overview
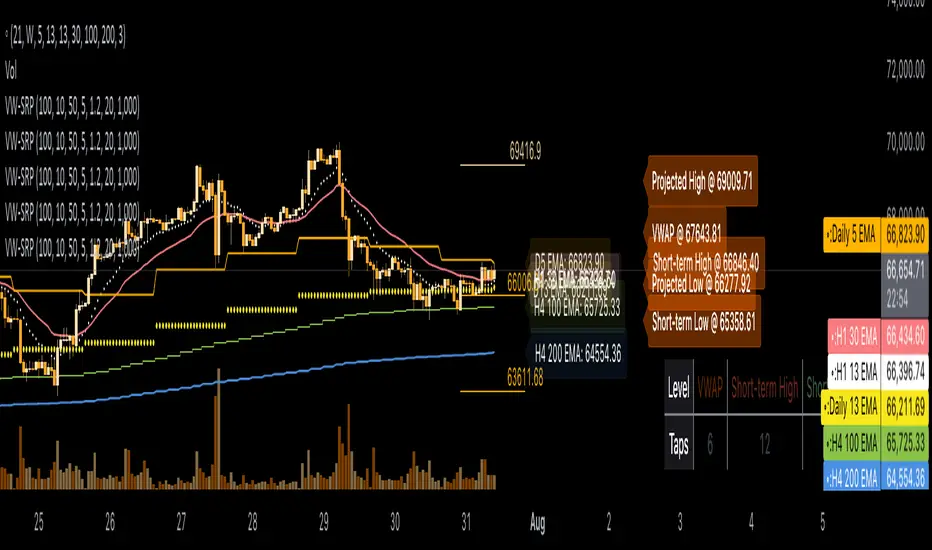
This TradingView PineScript indicator, "Volume-Weighted Support and Resistance with Projections" (VW-SRP), identifies key support and resistance levels based on volume-weighted average price (VWAP), short-term highs and lows, and projects future levels using standard deviation. It also provides a dashboard displaying the strength of each level based on the number of volume-based taps.
Features
VWAP Calculation: Computes the volume-weighted average price over a specified lookback period.
Support and Resistance Levels: Identifies short-term high and low levels within a rolling window.
Projected Levels: Calculates projected high and low levels based on standard deviation.
Volume-Based Strength: Counts the number of times each level is tested with significant volume.
Dynamic Labels: Displays labels for key levels and updates their positions periodically.
Dashboard: Shows the strength of each level in terms of volume-based taps.
Inputs
Lookback Period: Number of bars to consider for VWAP calculation (default: 100).
Projection Period: Number of bars for projecting future levels (default: 10).
Projection Offset: Number of bars to offset labels into the future (default: 15).
Update Interval: Frequency of updating labels and dashboard in bars (default: 5).
Standard Deviation Multiplier: Multiplier for calculating projected levels (default: 2.0).
Rolling Window: Number of bars for identifying short-term highs and lows (default: 20).
Volume Threshold: Minimum volume for counting taps (default: 1000).
Show Labels: Toggle for displaying labels on the chart (default: true).
Custom Colors
Light Red: color.rgb(255, 99, 71, 90)
Dark Red: color.rgb(205, 92, 92, 90)
White: color.new(color.white, 90)
Deep Orange: color.new(#f46200, 90)
Light Green: color.rgb(144, 238, 144, 90)
Text Color: color.white
Configuring the Indicator
Lookback Period: Set the number of bars for VWAP calculation.
Projection Period: Define the number of bars for projecting future levels.
Projection Offset: Set the number of bars to offset labels.
Update Interval: Choose how often the labels and dashboard should update.
Standard Deviation Multiplier: Adjust the multiplier for projected levels.
Rolling Window: Define the window for identifying short-term highs and lows.
Volume Threshold: Set the minimum volume for counting taps.
Show Labels: Toggle to display or hide labels.
Interpreting the Indicator
VWAP: The volume-weighted average price over the specified lookback period.
Short-term High/Low: The highest and lowest prices within the rolling window.
Projected High/Low: Future projections based on standard deviation.
Dashboard: Displays the strength of each level in terms of volume-based taps.
Visual Elements
Labels: Display the price levels and their respective values.
Dashboard: Located at the bottom-right corner of the chart, showing the number of taps for each level.
Example Usage
To use this indicator effectively, look for price reactions around the VWAP and projected levels. Strong volume-based taps at these levels indicate significant support or resistance. Adjust the input parameters to match your preferred timeframe and trading style
Overview
This TradingView PineScript indicator, "Volume-Weighted Support and Resistance with Projections" (VW-SRP), identifies key support and resistance levels based on volume-weighted average price (VWAP), short-term highs and lows, and projects future levels using standard deviation. It also provides a dashboard displaying the strength of each level based on the number of volume-based taps.
Features
VWAP Calculation: Computes the volume-weighted average price over a specified lookback period.
Support and Resistance Levels: Identifies short-term high and low levels within a rolling window.
Projected Levels: Calculates projected high and low levels based on standard deviation.
Volume-Based Strength: Counts the number of times each level is tested with significant volume.
Dynamic Labels: Displays labels for key levels and updates their positions periodically.
Dashboard: Shows the strength of each level in terms of volume-based taps.
Inputs
Lookback Period: Number of bars to consider for VWAP calculation (default: 100).
Projection Period: Number of bars for projecting future levels (default: 10).
Projection Offset: Number of bars to offset labels into the future (default: 15).
Update Interval: Frequency of updating labels and dashboard in bars (default: 5).
Standard Deviation Multiplier: Multiplier for calculating projected levels (default: 2.0).
Rolling Window: Number of bars for identifying short-term highs and lows (default: 20).
Volume Threshold: Minimum volume for counting taps (default: 1000).
Show Labels: Toggle for displaying labels on the chart (default: true).
Custom Colors
Light Red: color.rgb(255, 99, 71, 90)
Dark Red: color.rgb(205, 92, 92, 90)
White: color.new(color.white, 90)
Deep Orange: color.new(#f46200, 90)
Light Green: color.rgb(144, 238, 144, 90)
Text Color: color.white
Configuring the Indicator
Lookback Period: Set the number of bars for VWAP calculation.
Projection Period: Define the number of bars for projecting future levels.
Projection Offset: Set the number of bars to offset labels.
Update Interval: Choose how often the labels and dashboard should update.
Standard Deviation Multiplier: Adjust the multiplier for projected levels.
Rolling Window: Define the window for identifying short-term highs and lows.
Volume Threshold: Set the minimum volume for counting taps.
Show Labels: Toggle to display or hide labels.
Interpreting the Indicator
VWAP: The volume-weighted average price over the specified lookback period.
Short-term High/Low: The highest and lowest prices within the rolling window.
Projected High/Low: Future projections based on standard deviation.
Dashboard: Displays the strength of each level in terms of volume-based taps.
Visual Elements
Labels: Display the price levels and their respective values.
Dashboard: Located at the bottom-right corner of the chart, showing the number of taps for each level.
Example Usage
To use this indicator effectively, look for price reactions around the VWAP and projected levels. Strong volume-based taps at these levels indicate significant support or resistance. Adjust the input parameters to match your preferred timeframe and trading style
نص برمجي محمي
تم نشر هذا النص البرمجي كمصدر مغلق. ومع ذلك، يمكنك استخدامه بحرية ودون أي قيود - تعرف على المزيد هنا.
إخلاء المسؤولية
لا يُقصد بالمعلومات والمنشورات أن تكون، أو تشكل، أي نصيحة مالية أو استثمارية أو تجارية أو أنواع أخرى من النصائح أو التوصيات المقدمة أو المعتمدة من TradingView. اقرأ المزيد في شروط الاستخدام.