OPEN-SOURCE SCRIPT
ka66: Gap Markers

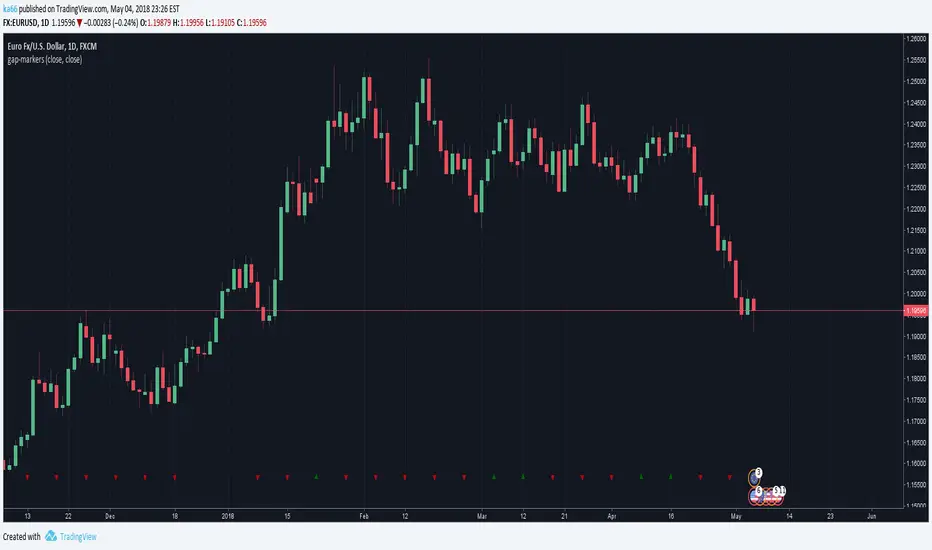
Marks bars having opening gaps, in either direction. Essentially where the opening price != closing price. The reference price defaults to close, but is configurable as an arbitrary source.
Larger gaps are easy to see visually but microgaps are more interesting, and indicate stronger shifts in sentiment, where enthusiasm towards a direction is increasing. They often signify the beginnings of strong trends.
Another signal when comparing open to high/low is a climactic type buy/sell.
Gapping is quite common in stocks, but not so much in 24H markets like Forex. It is expected this indicator has a much stronger value in these markets.
This indicator places up/down marks at the bottom of a chart, the rarity of these markers is a stronger signal than a higher frequency of occurrence.
Daily charts are likely the best spot for this indicator. Weeklies will almost always have gaps.
As usual, this is just one datapoint to consider among a confluence of others to verify a hypothesis.
Microgap Idea Credit, Price Action Course
نص برمجي مفتوح المصدر
بروح TradingView الحقيقية، قام مبتكر هذا النص البرمجي بجعله مفتوح المصدر، بحيث يمكن للمتداولين مراجعة وظائفه والتحقق منها. شكرا للمؤلف! بينما يمكنك استخدامه مجانًا، تذكر أن إعادة نشر الكود يخضع لقواعد الموقع الخاصة بنا.
إخلاء المسؤولية
لا يُقصد بالمعلومات والمنشورات أن تكون، أو تشكل، أي نصيحة مالية أو استثمارية أو تجارية أو أنواع أخرى من النصائح أو التوصيات المقدمة أو المعتمدة من TradingView. اقرأ المزيد في شروط الاستخدام.