Statistical Price Bands with MTF Bands by QTX Algo Systems
Overview
This indicator builds on the original Statistical Price Bands with Trend Filtering script by introducing Multi-Timeframe (MTF) Band Visualization. While the base version calculated adaptive price bands using statistical percentiles, trend filtering, and volatility adjustments, this enhanced version adds support/resistance bands from multiple timeframes onto the current chart.
This is not a minor cosmetic update. The MTF version includes additional request.security() logic and significantly increases context by allowing traders to reference band extremes from longer or shorter timeframes without switching charts. For this reason, the original and MTF versions are maintained separately, as this script requires a Pro+ or Premium TradingView plan to function correctly.
What’s New in This Version
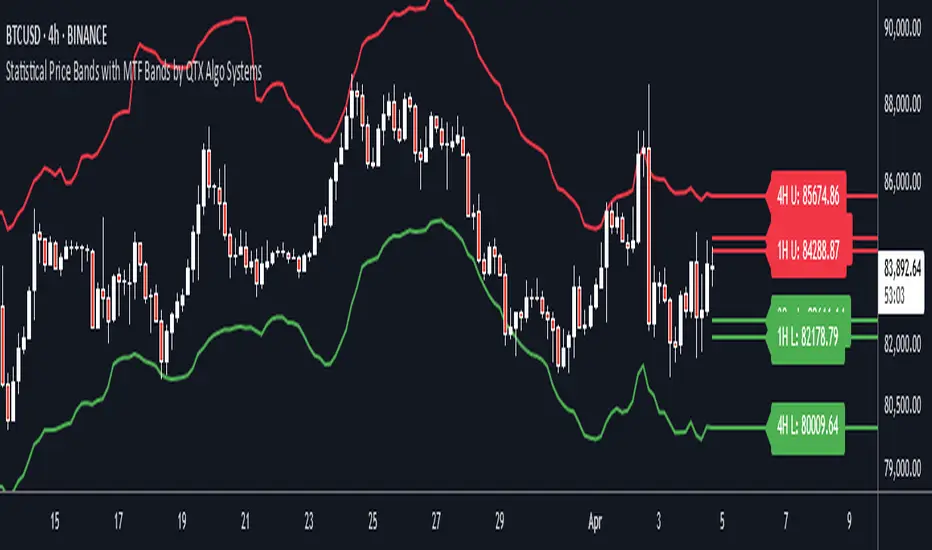
Multi-Timeframe Band Support: Fetches and displays upper and lower bands from other timeframes (e.g., 30min, 1H, 4H, 1D, 1W, 1M).
Chart-Based MTF Labels: Each band is labeled with its source timeframe (e.g., “1D U” = 1-Day Upper Band) for easy visual reference.
Custom Timeframe Control: Users can toggle specific timeframes on/off depending on their preferences and strategy.
Core Calculation Method (Unchanged)
Statistical Percentile Calculation:
Determines upper and lower thresholds using a historical percentile method applied to price deviations from a VWMA anchor.
Volatility Adjustment:
Dynamically scales the percentile thresholds based on a volatility factor (standard deviation vs. moving average).
Trend Filtering:
Adds a directional bias based on whether price is above or below its VWMA, pushing the bands higher in uptrends and lower in downtrends.
MTF Band Integration
This version calculates additional statistical bands using the same logic as the chart’s timeframe, but applies it to other timeframes selected by the user. These values are fetched using request.security() and then plotted onto the current chart using lines and labels.
This functionality allows traders to:
See if current price is extended compared to higher timeframe extremes.
Spot trend continuation or exhaustion relative to intraday or macro levels.
Identify areas of confluence for trade entries, exits, or stop placement.
Inputs & Customization
Statistical Percentile (default: 95)
Controls how extreme the bands are. Higher values = wider bands.
Lookback Period (default: 350)
Number of bars used to calculate percentiles. Longer = smoother bands.
VWMA Length (default: 20)
Sets the moving average anchor for calculating relative price deviation.
Volatility Factor Multiplier (default: 1.0)
Scales the influence of market volatility on band width.
Trend Strength Multiplier (default: 10.0)
Adjusts how far bands shift in the direction of the trend.
Timeframe Toggles (MTF)
Select which timeframes (e.g., 1H, 4H, 1D, 1W) to show on the chart.
Label Offset
Controls how far right MTF labels appear on the chart.
Use Case Scenarios
Overextension Detection:
Price touching or breaching an MTF band may suggest exhaustion, especially if confirmed by confluence or divergence.
Trend Confirmation:
Bands tilting in one direction across multiple timeframes can suggest strong trend alignment.
Risk Management:
Use bands from higher timeframes as trailing stops or invalidation zones.
Why This Is a Separate Script
This version uses request.security() to retrieve values from multiple timeframes, which:
Requires an upgraded TradingView plan (Pro+ or higher).
May impact performance on lower-tier plans.
Provides a major functional difference from the original, not a minor tweak or cosmetic upgrade.
To maintain compatibility and accessibility for all users, both versions are published separately:
The original for single-timeframe users.
This version for those using a multi-timeframe workflow.
Disclaimer
This script is for educational purposes only. It is intended to support your analysis—not to predict outcomes or replace risk management. Past performance is not indicative of future results. Always perform your own analysis and trade responsibly.
نص برمجي للمستخدمين المدعوين فقط
يمكن فقط للمستخدمين الذين تمت الموافقة عليهم من قبل المؤلف الوصول إلى هذا البرنامج النصي. ستحتاج إلى طلب الإذن والحصول عليه لاستخدامه. يتم منح هذا عادةً بعد الدفع. لمزيد من التفاصيل، اتبع تعليمات المؤلف أدناه أو اتصل ب QTXAlgoSystems مباشرة.
لا توصي TradingView بالدفع مقابل برنامج نصي أو استخدامه إلا إذا كنت تثق تمامًا في مؤلفه وتفهم كيفية عمله. يمكنك أيضًا العثور على بدائل مجانية ومفتوحة المصدر في نصوص مجتمعنا.
تعليمات المؤلف
إخلاء المسؤولية
نص برمجي للمستخدمين المدعوين فقط
يمكن فقط للمستخدمين الذين تمت الموافقة عليهم من قبل المؤلف الوصول إلى هذا البرنامج النصي. ستحتاج إلى طلب الإذن والحصول عليه لاستخدامه. يتم منح هذا عادةً بعد الدفع. لمزيد من التفاصيل، اتبع تعليمات المؤلف أدناه أو اتصل ب QTXAlgoSystems مباشرة.
لا توصي TradingView بالدفع مقابل برنامج نصي أو استخدامه إلا إذا كنت تثق تمامًا في مؤلفه وتفهم كيفية عمله. يمكنك أيضًا العثور على بدائل مجانية ومفتوحة المصدر في نصوص مجتمعنا.