OPEN-SOURCE SCRIPT
BCVC - Volume & Big Candle Color
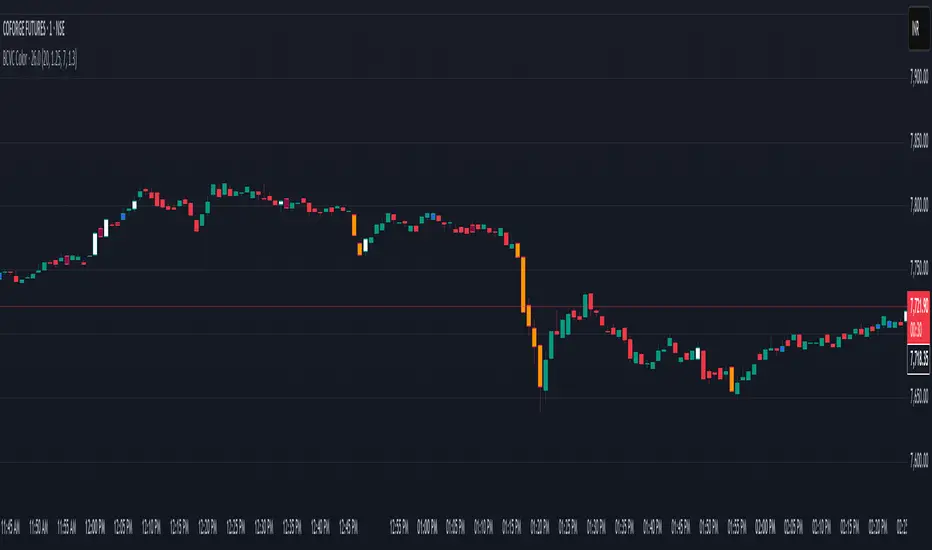
The BCVC (Volume & Big Candle Color) indicator helps traders identify significant price movements accompanied by unusual volume activity. By dynamically coloring bars based on volume spikes and candle size, it highlights potential momentum shifts, breakouts, or reversals. This tool is ideal for traders who want to:
Spot institutional buying/selling activity.
Confirm trend strength using volume and price volatility.
Filter noise by focusing on high-impact bars.
Key Features
Volume Spike Detection:
Compares current volume to a moving average (EMA) of volume.
Highlights bars where volume exceeds the average by a user-defined multiplier.
Big Candle Detection:
Identifies bars with a range (high-low) larger than the historical average range (EMA of candle ranges).
Thresholds for "big candles" are customizable.
Color-Coded Logic:
White Bars: High volume + Big candle + Bullish (close > open).
Orange Bars: High volume + Big candle + Bearish (close < open).
Blue Bars: High volume + Regular candle + Bullish.
Maroon Bars: High volume + Regular candle + Bearish.
Input Parameters
Volume Settings:
Volume Period: EMA length for average volume calculation (default: 20).
Volume Multiplier: Threshold multiplier for volume spikes (e.g., 1.25 = 25% above average).
Candle Size Settings:
Lookback Period: EMA length for average candle range (default: 7).
Big Candle Multiplier: Threshold multiplier for large candles (e.g., 1.3 = 30% above average range).
How It Works
Volume Analysis:
The indicator calculates an EMA of volume over the specified period.
If the current bar’s volume exceeds Average Volume × Volume Multiplier, it’s flagged as a high-volume bar.
Candle Range Analysis:
The average candle range (high-low) is calculated using an EMA over the lookback period.
A "big candle" is identified when the current bar’s range exceeds Average Range × Big Candle Multiplier.
Combined Signals:
High-volume bars are colored based on whether they are bullish/bearish and whether their range exceeds the big-candle threshold.
Example: A white bar (high volume + big candle + bullish) suggests strong buying pressure with institutional participation.
Usage Scenarios
Breakout Confirmation: A white/orange bar at a support/resistance level may validate a breakout.
Reversal Signals: A maroon/orange bar after a long trend could indicate exhaustion and potential reversal.
Trend Strength: Clusters of blue/white bars during uptrends (or maroon/orange in downtrends) confirm momentum.
Benefits
Visual Clarity: Instantly spot high-impact bars without manually scanning volume or candle size.
Customizable Sensitivity: Adjust multipliers to filter noise (e.g., increase for fewer signals).
Universal Application: Works on all timeframes and instruments (stocks, forex, crypto).
Notes
Best Paired With: Trendlines, support/resistance levels, or momentum oscillators (e.g., RSI).
Avoid False Signals: Use higher multipliers (e.g., 1.5) on lower timeframes to reduce noise.
نص برمجي مفتوح المصدر
بروح TradingView الحقيقية، قام مبتكر هذا النص البرمجي بجعله مفتوح المصدر، بحيث يمكن للمتداولين مراجعة وظائفه والتحقق منها. شكرا للمؤلف! بينما يمكنك استخدامه مجانًا، تذكر أن إعادة نشر الكود يخضع لقواعد الموقع الخاصة بنا.
إخلاء المسؤولية
لا يُقصد بالمعلومات والمنشورات أن تكون، أو تشكل، أي نصيحة مالية أو استثمارية أو تجارية أو أنواع أخرى من النصائح أو التوصيات المقدمة أو المعتمدة من TradingView. اقرأ المزيد في شروط الاستخدام.