OPEN-SOURCE SCRIPT
ADR Study [TFO]
This indicator is focused on the Average Daily Range (ADR), with the goal of collecting data to show how often price reaches/closes through these levels, as well as a look at historical moves that reached ADR and at similar times of day to study how price moved for the remainder of the session.
The ADR here (blue line) is calculated using the difference between a day's highest and lowest points. If our ADR length is 5, then we are taking this difference from the last 5 days and averaging them together. At the following day's open, we take half of this average and plot it above and below the daily opening price to place theoretical limits on how far price may move according to the lookback period. The triangles indicate when price has reached ADR (either +ADR or -ADR), and alerts can be created for these events.

The Scale Factor is an optional parameter to scale the ADR by a certain amount. If set to 2 for example, then the ADR would be 2x the average daily range. This value will be reflected in the statistics options so that users can see how different values affect the outcomes.

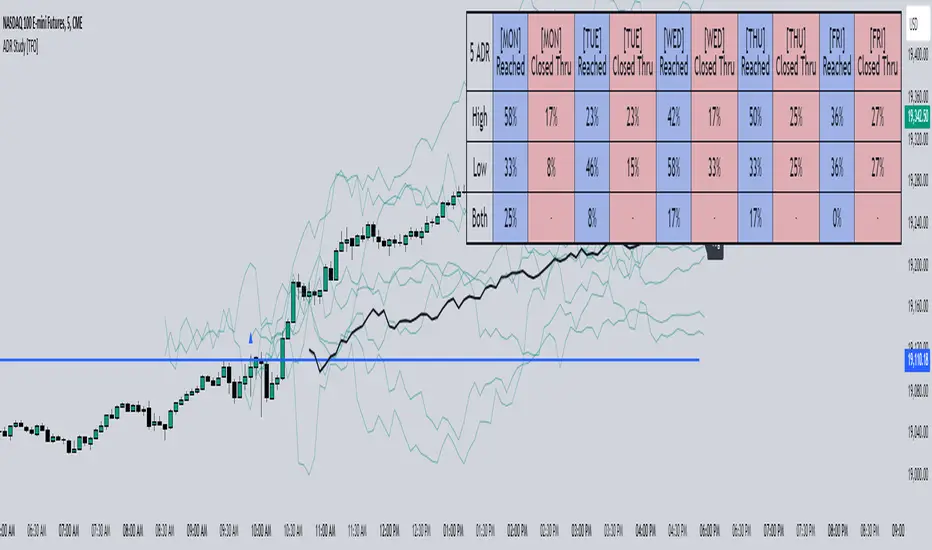
Show Table will display data collected on how often price reaches these levels, and how often price closes through them, for each day of the week. By default, these are colored as blue and red, respectively. From the following chart of NQ1!, we can see for example that on Mondays, price reached +ADR 38% of the time and closed through it 23% of the time. Note that the statistics for closing through the ADR levels are derived from all instances, not just those that reached ADR.

Show Sample Sizes will display how many instances were collected for all given sets of data. Referring to the same example of NQ1!, we can see that this particular chart has collected data from 109 Mondays. From those Mondays, 41 reached +ADR (38%, verifying our initial claim) and 25 closed through it (23%). This is important to understand the scope of the data that we're working with, as percentages can be misleading for smaller sample sizes.

Show Histogram will plot the same exact data as the table, just in a histogram form to visually emphasize the differences on a day-by-day basis. On this chart of RTY1!, we can see for example from the top histogram that on Wednesdays, 40% reached +ADR and only 22% closed through it. Similarly if we look at the bottom histogram, we can see that Wednesdays reached -ADR 46% of the time and closed through it only 28% of the time.

We can also use Show Sample Sizes to display the same information that would be in the table, showing how many instances were collected for each event. In this case we can see that we observed 175 Fridays, where 76 reached +ADR (43%) and 44 closed above it (25%).

Show Historical Moves is an interesting feature of this script. When enabled, if price has reached +/- ADR in the current session, the indicator will plot the evolution of the close prices from all past sessions that reached +/- ADR to see how they traded for the remainder of the session. These calculations are made with respect to the ADR range at the time that price traded through these levels.

Historical Proximity (Bars) allows the user to observe historical moves where price reached ADR within this many bars of the current session (assuming price has reached an ADR level in the current session). In the above chart, this is set to 1000 so that we can observe each and every instance where price reached an ADR level. However, we can refine this a bit more.
By limiting the Historical Proximity to something like 20, we are only considering historical moves that reached ADR within 20 bars of todays +ADR reach (9:50 am EST, noted by the blue triangle up). We can enable Show Average Move to display the average move by the filtered dataset, and Match +/-ADR to only observe moves inline with the current day's price action (in this case, only moves that reached +ADR, since price has not reached -ADR).

We can add one more filter to this data with the setting Only Show Days That: closed through ADR; closed within ADR; or either. The option either is what you see above, as we are considering both days that closed through ADR and days that closed within it (note that in this case, closing within ADR simply means that price reached +ADR and closed the day below it, and vice versa for -ADR; this does not mean that price must have closed in between +ADR and -ADR). If we set this to only show instances that closed within ADR, we see the following data.

Alternatively, we can choose to Only Show Days That closed through ADR, where we would see the following data. In this case, the average move very much resembles the price action that occurred on this particular day. This is in no way guaranteed, but it makes an interesting case for how we could use this data in our analysis by observing similar, historical price action.

Please note that this data will change over time on a rolling basis due to TradingView's bar lookback, and that for this same reason, lower timeframes will yield less data than larger timeframes.
The ADR here (blue line) is calculated using the difference between a day's highest and lowest points. If our ADR length is 5, then we are taking this difference from the last 5 days and averaging them together. At the following day's open, we take half of this average and plot it above and below the daily opening price to place theoretical limits on how far price may move according to the lookback period. The triangles indicate when price has reached ADR (either +ADR or -ADR), and alerts can be created for these events.
The Scale Factor is an optional parameter to scale the ADR by a certain amount. If set to 2 for example, then the ADR would be 2x the average daily range. This value will be reflected in the statistics options so that users can see how different values affect the outcomes.
Show Table will display data collected on how often price reaches these levels, and how often price closes through them, for each day of the week. By default, these are colored as blue and red, respectively. From the following chart of NQ1!, we can see for example that on Mondays, price reached +ADR 38% of the time and closed through it 23% of the time. Note that the statistics for closing through the ADR levels are derived from all instances, not just those that reached ADR.
Show Sample Sizes will display how many instances were collected for all given sets of data. Referring to the same example of NQ1!, we can see that this particular chart has collected data from 109 Mondays. From those Mondays, 41 reached +ADR (38%, verifying our initial claim) and 25 closed through it (23%). This is important to understand the scope of the data that we're working with, as percentages can be misleading for smaller sample sizes.
Show Histogram will plot the same exact data as the table, just in a histogram form to visually emphasize the differences on a day-by-day basis. On this chart of RTY1!, we can see for example from the top histogram that on Wednesdays, 40% reached +ADR and only 22% closed through it. Similarly if we look at the bottom histogram, we can see that Wednesdays reached -ADR 46% of the time and closed through it only 28% of the time.
We can also use Show Sample Sizes to display the same information that would be in the table, showing how many instances were collected for each event. In this case we can see that we observed 175 Fridays, where 76 reached +ADR (43%) and 44 closed above it (25%).
Show Historical Moves is an interesting feature of this script. When enabled, if price has reached +/- ADR in the current session, the indicator will plot the evolution of the close prices from all past sessions that reached +/- ADR to see how they traded for the remainder of the session. These calculations are made with respect to the ADR range at the time that price traded through these levels.
Historical Proximity (Bars) allows the user to observe historical moves where price reached ADR within this many bars of the current session (assuming price has reached an ADR level in the current session). In the above chart, this is set to 1000 so that we can observe each and every instance where price reached an ADR level. However, we can refine this a bit more.
By limiting the Historical Proximity to something like 20, we are only considering historical moves that reached ADR within 20 bars of todays +ADR reach (9:50 am EST, noted by the blue triangle up). We can enable Show Average Move to display the average move by the filtered dataset, and Match +/-ADR to only observe moves inline with the current day's price action (in this case, only moves that reached +ADR, since price has not reached -ADR).
We can add one more filter to this data with the setting Only Show Days That: closed through ADR; closed within ADR; or either. The option either is what you see above, as we are considering both days that closed through ADR and days that closed within it (note that in this case, closing within ADR simply means that price reached +ADR and closed the day below it, and vice versa for -ADR; this does not mean that price must have closed in between +ADR and -ADR). If we set this to only show instances that closed within ADR, we see the following data.
Alternatively, we can choose to Only Show Days That closed through ADR, where we would see the following data. In this case, the average move very much resembles the price action that occurred on this particular day. This is in no way guaranteed, but it makes an interesting case for how we could use this data in our analysis by observing similar, historical price action.
Please note that this data will change over time on a rolling basis due to TradingView's bar lookback, and that for this same reason, lower timeframes will yield less data than larger timeframes.
نص برمجي مفتوح المصدر
بروح TradingView الحقيقية، قام مبتكر هذا النص البرمجي بجعله مفتوح المصدر، بحيث يمكن للمتداولين مراجعة وظائفه والتحقق منها. شكرا للمؤلف! بينما يمكنك استخدامه مجانًا، تذكر أن إعادة نشر الكود يخضع لقواعد الموقع الخاصة بنا.
إخلاء المسؤولية
لا يُقصد بالمعلومات والمنشورات أن تكون، أو تشكل، أي نصيحة مالية أو استثمارية أو تجارية أو أنواع أخرى من النصائح أو التوصيات المقدمة أو المعتمدة من TradingView. اقرأ المزيد في شروط الاستخدام.