SMC Orderblocks (MTF)
This tool helps traders pinpoint areas where significant institutional trades are likely to occur by assuming the presence of orderblocks based on observed market behavior.
Unlike other indicators that may rely heavily on volume, the SMC Orderblocks Indicator offers a fresh approach rooted in a deep study of price action and Smart Money Concepts (SMC).
🔍 Unique Approach
Unlike other orderblock indicators that typically depend on volume to detect orderblocks (a common and valid method), the SMC Orderblocks Indicator explores a new approach. After extensive study and understanding of price action and SMC principles, this indicator focuses on market behavior to assume where institutional orderblocks might be. This approach offers traders a unique perspective and valuable insights, allowing them to view the market through a different lens.
🧠 The Theory Behind It
In trading, liquidity is essential for institutions and large market participants to execute their substantial orders. Orders tend to cluster around predictable levels, such as recent highs or lows, creating pools of liquidity. To secure better entry points for their large trades, institutions and market makers may manipulate prices to sweep these liquidity levels. The SMC Orderblocks Indicator is designed to detect these market manipulations—when price moves to capture liquidity—and uses these events to assume the presence of orderblocks at key levels. By recognizing these manipulations, the indicator provides insights into potential areas of significant institutional activity.
⚙️ How It Works
In order to make it work, there are two big essentail parts for this indicator. The first one is being able to identify liquidity areas. The second one is to detect the liquidity grab pattern.
1. Identifying Liquidity
So, in order to find market manipulations, mainly "liquidity grabs", the first thing we need is to find where the liquidity is.
Here "liquidity", refers to "orders", and only the exchange actually knows at what price orders are placed. The limit orders are visible in the order book and most of the time the exchange let this information be publicly accessed. But not all orders are in the orderbook. The stop-limit orders like stop-loss orders are added in the orderbook only when the market price reaches a certain price (the stop price).
At present, when using a chart script like Pinescript, there is no known way to access this real information.
But fortunately, traders and institutional behavior stay the same. Traders tend to place their orders at predictable levels, like above highs or below lows. They can also be near inducement areas, specifically created by institutions to induce traders to place their orders at certain levels.
So, the job of the indicator is first to find these levels, regardless of the method used. In the previous version of this script, I used pivots to detect highs and lows, but this method was lacking when it came to finding inducement zones or stacks of liquidity.
Instead, the indicator now uses a new method to check whether there is a stack of non-liquidated candles. This method allows the detection of inducement zones with unliquidated candles. When the stack reaches a certain number (by default, three), the liquidity is marked as valid for sweep detection.
Note: When using the indicator, you can enable the display of liquidity (to see mitigated and unmitigated liquidity) and their stack number.
2. Detecting a Liquidity sweep
Once the first and key part is done, we need to detect the market manipulation: the liquidity grabs. Liquidity grab patterns are always the same. In the following example, let's assume the institutions want to fill sell orders in a bearish market. Here are the steps they will likely take:
- 1. The institutionals place their main orders (the orderblock) at a desired price.
- 2. They let the liquidity accumulate next to that desired price. They can even induce traders to place their own orders there. The will serve as liquidity.
- 3. Institutionals will manipulate the market price to move it towards their awaiting orders to fill them. Once that price is reach, and their orders are being filled, the market price will start moving in the opposite direction.
- 4. The grab is confirmed, when the liquidity in that oppsiite direction is grabed, or simply when the bearish market trend resumes by breaking the lows, along with additional confirmations
Sometimes, institutions will have two opposite positions in the same asset—one short and one long. This is called hedging. The goal here is to use the long orders to push the market price towards the main sell orders. Once the sell orders are filled and the market price starts falling, they may try to push it up again to close their long position with minimal loss and finally let the price fall for good.
It is at that moment that it is best to enter the market. This is why, by default, the indicator will display when the price starts moving upward towards the liquidity grab: because it's where the manipulation started and where the price is likely to reach again before resuming the main trend.
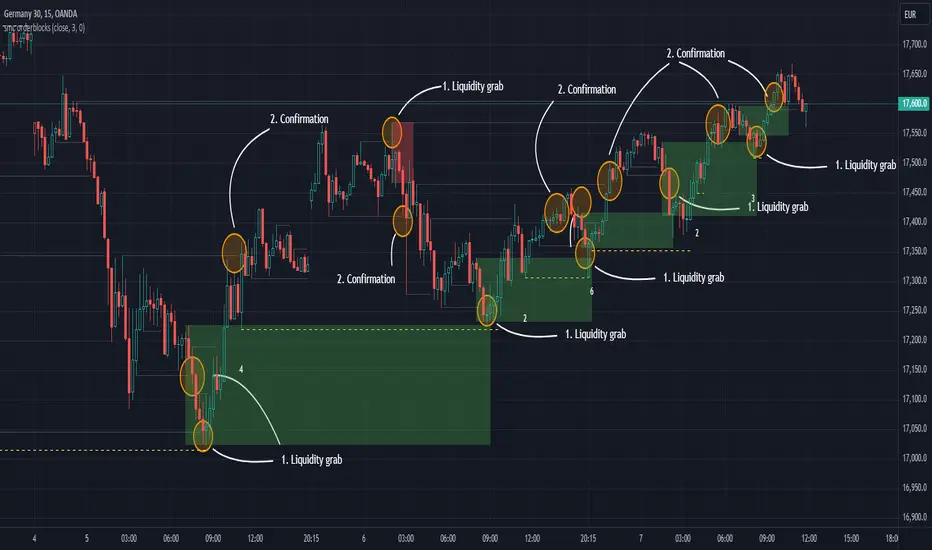
Real-Time Visualization:
As soon as an "orderblock" (or market manipulation) is detected, the indicator will display it on the chart in real time.
This immediate visualization helps traders stay ahead and catch the main market move.
💡 Usage Tips
Apply the script to your chart. This is a price-action based script so it will work on most markets. You do not need to edit settings but you can adjust them to match your trading style.
To get the most out of the SMC Orderblocks Indicator, it’s recommended to use it alongside other analysis tools, espacially market structure indicators. You can try the free-to-use SMC Market Structure (MTF) to filter the interesting orderblocks.
Additionnaly, if you search liquidity areas to set as your trade's target, you can enable their display to see mitigated and unmitigated liquidity lines. The display is disabled by default to keep charts clean.
While the indicator helps detect potential institutional orderblocks based on liquidity grabs, combining its insights with your trading knowledge and other tools will enhance decision-making.
⚠️ Disclaimer
While this method provides useful information, the orderblocks can only be assumed based on market behavior. Moreover, given how the indicator works, the accuracy cannot be guaranteed. It's important to combine the indicator's information with your own experience and other confirmation methods.
Orderblocks are also time-sensitive. The fact that an orderblock was detected and displayed on the chart does not guarantee that orders will still be present when the price returns to that level. If too much time has elapsed since the orderblock was created, or if the market structure has changed, it may be wise to disregard it. Always seek additional confirmation before opening a position.
The theory presented here on how institutional orderblocks are made, and how the market may be manipulated to fill orders, is based on my own research, knowledge, and analysis. Since I have never worked within an institution, these are educated assumptions and could be incorrect. Please always do your own research.
🚀 Active Development
The SMC Orderblocks Indicator is continuously evolving, with updates aimed at improving the rules for detecting and confirming orderblocks. Future updates may include new features and bug fixes to enhance performance and adapt to different trading styles.
📬 Note: If you encounter a bug, please contact me directly via private message, as I do not want to pollute the comment section with screenshots.
If you have any questions or suggestions for new features, feel free to reach out. You can also add a comment to boost its visibility.
Additionally, it’s recommended to compare the results of this indicator with others to find what best suits your trading style.
Please note that while this indicator is a paid script, you do not need to pay to test it. Contact me directly on TradingView via private message or through my socials, or leave a comment, and I’ll provide you with a free trial.
- Add display settings for liquidity lines and colors
CONFIRMATIONS
- Option to confirm an orderblock at candle close (default)
- Option to confirm an orderblock at candle wick (high/low).
Both of these features can work at the same time. The second one is for traders with an agressive style.
- Option to confirm an orderblock according to its start, instead of the closest non-mitigated liquidity. Sometimes, the non mitigated liquidity for confirmation may be too far, so enabling this feature allows an earlier confirmation.
- Option to automatically disregard and invalidate an orderblock if the liquidity sweep allows to many candles to close beyond the liquidity price. If the user consider that a sweep should not have any close, set to 1.
Add options to choose if filtered orderblocks should still appear, but in a disabled color.
MULTI-TIMEFRAME
The SMC Orderblocks indicator is now Multi-Timeframe :D !
You can now select up to 3 timeframes to display orderblocks and liquidity areas, all without leaving your current chart.
This improvement will be useful for every trader, especially scalpers.
Here’s an example of how you can use the indicator to take sniper entries and targets :
This is a major update. If you encounter any issues or regressions, please let me know via private message.
I suggest you use SMC Market Structure (MTF) or any indicator that plots the trend according to a specific timeframe.
- Add lines for ongoing liquidation, to let user see when an important liquidity is being swept, without having to wait for orderblock confirmation.
- Add lines for confirmed orderblock liquidity, allowing to check what the orderblock was created from.
This update should enhance overall detection and user experience, if you encounter any issue please let me know in private messages.
- Invalid orderblocks after weak reintegration (BETA)
This feature aims to reduce the number of false positives and potentially weak orderblocks by checking the price action. When enabled (by default), it is also possible that some completely valid orderblocks will be invalidated.
- Feat: add "Check liquidity windows (BETA)" to prevent liquidity stack to grow they are too far appart. This prevents new pivots to extend old liquidity, and it avoids false or weak orderblocks to be detected from it.
ORDERBLOCK CONFIRMATION
- Feat: add "No orderblocks for old liquidity. (BETA)" to prevent detecting orderblocks using an old liquidity. This is essential as liquidity is time-sensitive.
Those features are enabled by default but can be disabled at any time for the moment.
نص برمجي للمستخدمين المدعوين فقط
يمكن فقط للمستخدمين الذين تمت الموافقة عليهم من قبل المؤلف الوصول إلى هذا البرنامج النصي. ستحتاج إلى طلب الإذن والحصول عليه لاستخدامه. يتم منح هذا عادةً بعد الدفع. لمزيد من التفاصيل، اتبع تعليمات المؤلف أدناه أو اتصل ب foreignAuthor47945 مباشرة.
لا توصي TradingView بالدفع مقابل برنامج نصي أو استخدامه إلا إذا كنت تثق تمامًا في مؤلفه وتفهم كيفية عمله. يمكنك أيضًا العثور على بدائل مجانية ومفتوحة المصدر في نصوص مجتمعنا.
تعليمات المؤلف
إخلاء المسؤولية
نص برمجي للمستخدمين المدعوين فقط
يمكن فقط للمستخدمين الذين تمت الموافقة عليهم من قبل المؤلف الوصول إلى هذا البرنامج النصي. ستحتاج إلى طلب الإذن والحصول عليه لاستخدامه. يتم منح هذا عادةً بعد الدفع. لمزيد من التفاصيل، اتبع تعليمات المؤلف أدناه أو اتصل ب foreignAuthor47945 مباشرة.
لا توصي TradingView بالدفع مقابل برنامج نصي أو استخدامه إلا إذا كنت تثق تمامًا في مؤلفه وتفهم كيفية عمله. يمكنك أيضًا العثور على بدائل مجانية ومفتوحة المصدر في نصوص مجتمعنا.