OPEN-SOURCE SCRIPT
تم تحديثه Ultimate RSI
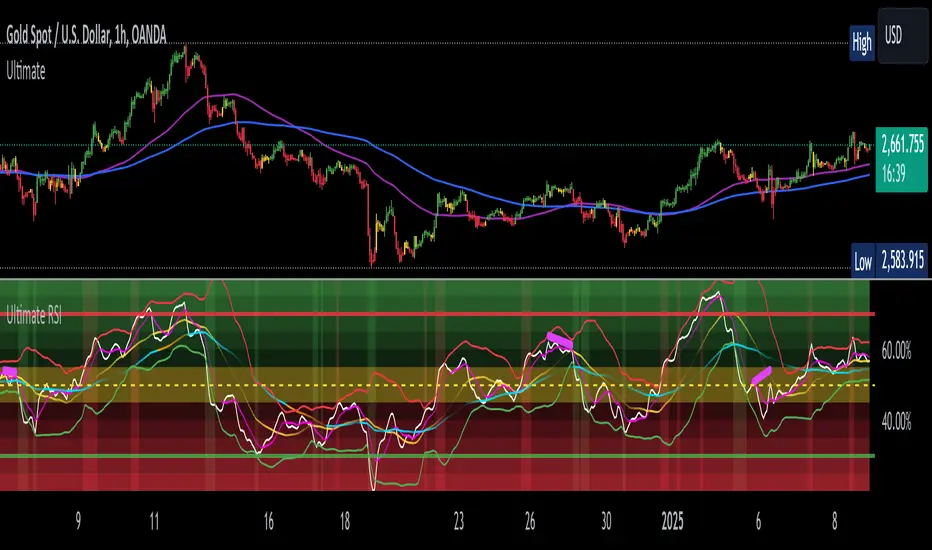
This indicator is a customized version of the RSI indicator that by default utilizes Bollinger Bands. It have included two layers of bands, with separate standard deviations. The indicator is fully customizable.
The indicator displays bullish and bearish divergence from price.
You are able to change the moving average that is used to calculate both the RSI itself, as well as the moving average used for the Bollinger Bands.
I have included fills that color the background to indicate various zones of RSI values.
Price tends to either reject or move quickly at these levels.
I have a yellow RSI zone that indicates a sideways market with little to no momentum with default values of 45 to 55. These are areas where trading is stagnant and you should likely avoid placing trades.
There is now an ATR feature to adjust the Bollinger Bands with ATR (Average True Range).
In order to trade with this indicator, you should watch for the white line (RSI) to cross into the Bollinger Bands, then cross over the yellow moving average (Basis line), where you would enter a BUY or SELL.
Watch this indicator in action and look for patterns. Draw vertical lines on the chart where you would have wanted to buy or sell and study this to understand how to make better trading decisions.
NOTE:
While not required in order to use this indicator, it was designed to visually work with another indicator of mine called The Ultimate Buy and Sell Indicator. I recommend using both together as they are a strong pair of indicators that share the same settings. This indicator while it can be used independently can also help you visualize the settings changes made to the other one which are unable to be displayed on the main chart by that indicator.
ملاحظات الأخبار
- Changed default settings- Removed "fast" RSI MA, but you can always go into the code and uncomment it (Remove the "//" in all of the sections that apply)
ملاحظات الأخبار
- Removed ATR option from band calculation (Not useful enough)- Added ADX: Average Directional Index (Neon blue line)
-- ADX is a trend strength indicator. It does NOT move in the direction of a trend, but rather higher values indicate the trend strength is stronger, lower values indicate the trend strength is weaker. --
- Removed unused code (clean-up)
- Changes to default settings
ملاحظات الأخبار
- Removed ADX line (not useful enough in hindsight, although working on something that will be)- Added a toggle to turn off the colored background fills with one click (Show Fills)
ملاحظات الأخبار
As always, I'm adding to this indicator to give it more functionality. Changes include the following:
- Neon glowing lines
- ROC of RSI colored RSI Line (optional)
- DPO colored Bollinger Bands (optional)
- Bullish/Bearish Price/RSI Divergence color changes and user inputs (colors optional)
ROC (Rate of Change) of RSI Coloring: A new toggle option has been introduced that allows users to color the RSI line based on its Rate of Change (ROC). When this option is enabled, the color of the RSI line changes dynamically to reflect the ROC's direction - indicating rising or falling momentum. If the toggle is turned off, the RSI line is displayed in white, providing a simpler, uncolored view.
DPO (Detrended Price Oscillator) for Bollinger Bands Coloring: Another toggle has been added to let users decide how the Bollinger Bands are filled in terms of color. When enabled, the color of the Bollinger Band fills is determined by the DPO's values - offering an additional layer of trend analysis. If this option is disabled, the upper band is filled in red and the lower band in green, offering a standard, fixed-color approach.
The Detrended Price Oscillator (DPO) is a technical analysis tool designed to remove the effect of the longer-term trend from the current price to focus on shorter-term fluctuations and cycles. Here's a more detailed explanation of how it's utilized in your "Ultimate RSI" indicator:
Concept of DPO in the Indicator:
DPO Calculation for Multiple Periods: The indicator calculates DPO values for ten different time periods. This is done by subtracting a moving average (calculated over each of these periods) from the current price. The moving average is shifted back by half the length of its period plus one, to center it and to remove the trend.
Averaging DPOs: The DPO values from these ten different periods are then averaged. This averaging process smooths out the volatility and provides a more consolidated view of the shorter-term cycles in price movements, independent of the longer-term trend.
Smoothing the Average DPO: The averaged DPO value is further smoothed using a selected type of moving average (like SMA, EMA, WMA, or RMA). This smoothing helps in making the indicator's output less susceptible to minor price changes and noise, making it easier to identify significant trends or cycles.
Usage in Bollinger Band Coloring:
DPO as a Color Indicator for Bollinger Bands: An option in your indicator allows using the smoothed average DPO to color the Bollinger Bands. This can add a dynamic aspect to the Bollinger Bands, where their color changes based on the trend indicated by the DPO.
Color Change Mechanism: The coloring is determined by comparing the current smoothed DPO value with its value a specified number of bars back (set by the user). If the current value is higher, it indicates an upward trend, and the color might be set to green; if lower, it indicates a downward trend, and the color might be red.
Importance of DPO in This Context:
Short-Term Trend Analysis: By focusing on shorter-term price cycles and removing the longer-term trend, the DPO can provide insights into potential reversals or pullbacks within the broader market movement.
Enhancing Bollinger Bands: Using DPO to color the Bollinger Bands adds another layer of analysis, potentially offering more nuanced insights into market dynamics, particularly regarding trend strength and potential reversals.
ملاحظات الأخبار
Updates: - ROC is now based on Price rather than RSI for better performance (The RSI Line has optional ROC-based coloring)
- Default settings changed again
--> NEW FEATURE --> Realize that this indicator was built with Bollinger Bands to take advantage of "mean reversion". With that in mind, the RSI only stays away from the RSI Basis for so long before coming home. The way you have the settings set will change this dramatically, so I have put some good settings into it, according to what I looked at.
-- With this update, the RSI Basis line will now become incrementally more transparent (begin to disappear) after a cross of the RSI over the line. Default starting color is yellow. Once the transparency hits a limit, it will reverse course and become less transparent (line gets brighter).
-- If it hits the limit again, it will change colors to orange, where it will then become more transparent, until it (and it probably never will) hits the limit again. It moves in 30 bar cycles because based on my research that was a good number to use.
-- IF YOU SEE ORANGE, then you need to start watching for an RSI cross over the basis because one is soon to come. Keep an eye on the color of the Bollinger Bands (if the DPO option is on) and the color of the RSI line (if the ROC option is on). Once a cross happens, it all starts over at yellow and fully visible.
-- If you are smarter than the average trader, you're probably (or should be) also using my Ultimate Buy and Sell Indicator, which has Bollinger Bands that change color based on the RSI basis or RSI trend direction (basis is the best setting for longer holds). Compare all of the things that turn red and green for the best timing of entries and exits, and to know when to hold. If they're all in agreement, you are likely to be better off holding through any volatility for a better payday. (no guarantees, anything can happen)
-- As always, monitor multiple timeframes for the best results and compare them to understand where you are in the cycle of a trade.
ملاحظات الأخبار
- NEW UPDATES: (descriptions below)1.) Buy and Sell "helpers" (Vertical background colors)
2.) Variable Bollinger Band transparency (user inputs)
3.) Reorganized settings menu
4.) Default settings changed (DPO specific)
5.) Two separate DPO periods (Upper band short, Lower band long)
Descriptions:
1.) Buy and Sell "helpers"
- What these do is look at the 3 things that switch between red and green. Those are the RSI line, which is based on Rate of Change of the price, a short DPO averaged moving average ribbon and a long DPO averaged moving average ribbon.
- It has inputs for you to tell it how many of them must be green in order for the RSI crossing over the basis to be counted as a buy signal. It checks how many must be red in order for RSI crossing under the basis to be counted as a sell signal.
- If you are (and should be) using "The Ultimate Buy and Sell Indicator", you can check buy and sell signals against these additional helper signals to validate or invalidate them, producing even better results (still not perfect, of course).
2.) Variable Bollinger Band Transparency
- You can now adjust how visible or invisible they are by increasing the number (they start to disappear) or the other way around by lower the number to make them more visible
5.) There used to be only one single DPO moving average ribbon, now there are two with fixed lengths.
Short version - Starts at 5 and goes up in 10 increments of 5 (ex. 5, 10, 15, 20, etc), is then averaged and used as the short DPO (upper band colors)
Long version - Starts at 10 and goes up in increments of 10 (ex. 10, 20, 30, 40, 50, etc.), is then averaged and used as the long DPO (lower band colors)
- This gives you a varied perspective on price action based on DPO calculations (which I really just did as an experiment, but found to be quite useful).
You can play around with the DPO bars back settings and smoothing factors, as well as the RSI Rate of Change settings to affect the buy and sell signal helpers. I've changed to settings that I find to be fairly good, but you can experiment on your own and share your findings in the comments.
Enjoy the new toys :)
ملاحظات الأخبار
UPDATE: I've made a number of changes today.
1.) The RSI line no longer changes color based on Rate of Change. This color change has been applied to the lower Bollinger Band instead for better viewability of the RSI line.
2.) I've added a DPO adjustment feature, as well as removed the secondary DPO ribbon. The upper Bollinger Band is now the DPO indicator exclusively. To recap, the way the DPO works is by creating a ribbon of 10 incrementing values. They start with 5 and go up in increments of 5, ten times. (5, 10, 15, 20, 25, 30, 35, 40, 45 and 50). Adjusting by 1 to the adjustment value will add one to each value, (6, 11, 16, etc.).
NOTE: When both Bollinger Bands are green, it is a relatively good sign that it is safe to buy, red the opposite (or whatever colors you change it to).
3.) I've added color inputs for the RSI line, as well as the UP and DOWN colors of the Bollinger Bands (default = green is up, red is down)
4.) I've renamed some things, and reorganized some of the settings and added some tooltips.
5.) I removed the buy and sell signals since they are better handled by "The Ultimate Buy and Sell Indicator" as it uses more complex logic than this indicator.
Additionally, it was requested to add trendlines to the indicator, and I'm still exploring whether or not this is needed beyond the divergence lines. Saving that for a future update.
ملاحظات الأخبار
UPDATE: 1.) Added two moving averages with color options
2.) Changed the ROC calculation to "close" rather than "OHLC4"
3.) Updated/corrected the DPO ribbon calculation
ملاحظات الأخبار
Updates:- Rearranged settings
- Removed the thick Bollinger Bands with DPO and ROC color changing. They are now simple lines that do not change colors. (for now anyways)
- Option to toggle Bollinger Bands off
- Updated the dynamic transparency of the RSI moving average crossover cycle to be customizable
- You can change linewidths now
- Removed some unnecessary things to clean things up
Feel free to make suggestions in the comments or send me a message
ملاحظات الأخبار
UPDATE:1.)
- Colors background when RSI crosses the Bollinger bands (lower/green) and (upper/red)
- Includes a toggle to turn it on and off
2.)
- Heiken Ashi smoothing for the RSI line in addition to the primary moving average smoothing
- Can be toggled on and off
3.)
- Corrected some errors I made last time
4.)
- Changed default settings
نص برمجي مفتوح المصدر
بروح TradingView الحقيقية، قام مبتكر هذا النص البرمجي بجعله مفتوح المصدر، بحيث يمكن للمتداولين مراجعة وظائفه والتحقق منها. شكرا للمؤلف! بينما يمكنك استخدامه مجانًا، تذكر أن إعادة نشر الكود يخضع لقواعد الموقع الخاصة بنا.
إخلاء المسؤولية
لا يُقصد بالمعلومات والمنشورات أن تكون، أو تشكل، أي نصيحة مالية أو استثمارية أو تجارية أو أنواع أخرى من النصائح أو التوصيات المقدمة أو المعتمدة من TradingView. اقرأ المزيد في شروط الاستخدام.