OPEN-SOURCE SCRIPT
Push and Exhaustion Strategy with VWAP and Moving Averages
Overview:
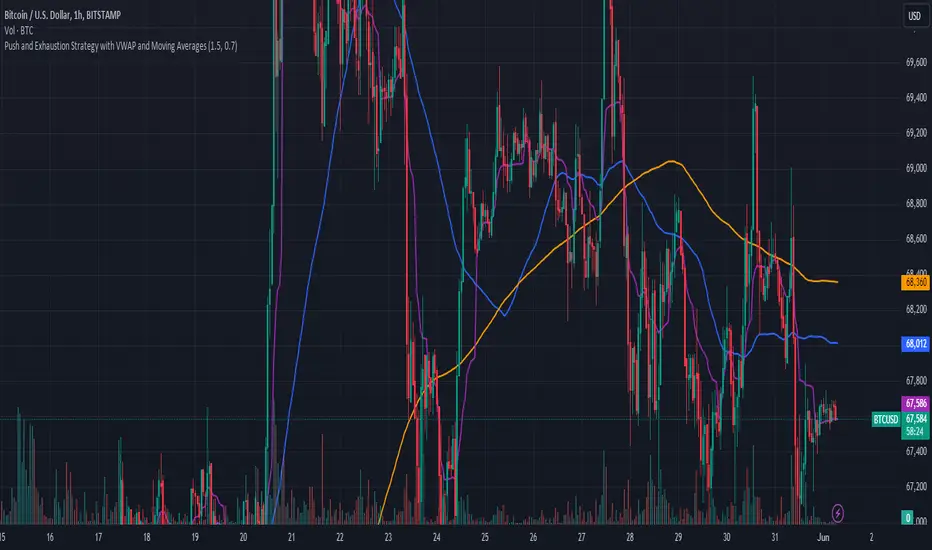
The Push and Exhaustion Strategy Indicator is a custom technical analysis tool designed to help traders identify potential market turning points by highlighting significant price movements (pushes) and subsequent periods of reduced momentum (exhaustion). This indicator also incorporates key moving averages (50-period and 200-period) and the Volume Weighted Average Price (VWAP) to provide additional context for trading decisions.
Components:
Push and Exhaustion Thresholds:
Push Threshold: Set at 1.5 by default. This means the price must increase by 50% or more compared to the previous close to signal a push.
Exhaustion Threshold: Set at 0.7 by default. This means the price must decrease by 30% or more compared to the previous close to signal exhaustion.
VWAP (Volume Weighted Average Price):
VWAP is plotted on the chart to provide an average price weighted by volume, giving insight into the true average price paid for an asset.
Moving Averages:
50-period Moving Average (MA): Plotted in blue, it helps identify the short-to-mid-term trend direction.
200-period Moving Average (MA): Plotted in orange, it helps identify the long-term trend direction.
How It Works:
Push Condition:
A push signal is generated when the current closing price is at least 1.5 times the previous closing price (pushThreshold).
Additionally, the closing price must be above the VWAP, indicating strong upward momentum.
When these conditions are met, a green triangle is plotted above the price bar.
Exhaustion Condition:
An exhaustion signal is generated when the current closing price is at most 0.7 times the previous closing price (exhaustionThreshold).
Additionally, the closing price must be below the VWAP, indicating weakened momentum and potential reversal.
When these conditions are met, a red triangle is plotted below the price bar.
Visualization:
The indicator plots green triangles above bars to indicate a push signal and red triangles below bars to indicate an exhaustion signal.
It also plots the 50-period and 200-period moving averages as blue and orange lines, respectively.
The VWAP is plotted as a purple line, showing the average price considering the trading volume.
Alerts:
The indicator includes optional alerts that notify the trader when a push or exhaustion signal is detected.
Usage:
Push Signals: Traders might use push signals to enter trades in the direction of strong momentum, typically buying in an uptrend.
Exhaustion Signals: Traders might use exhaustion signals to anticipate potential reversals, considering exiting positions or entering counter-trend trades.
Moving Averages: The 50-period and 200-period moving averages help provide context to the overall trend, aiding in decision-making.
VWAP: Being above or below the VWAP helps validate the strength of the price movement.
This indicator provides a comprehensive view of market momentum, aiding traders in making informed decisions by highlighting significant price moves and potential reversals within the context of prevailing trends.
نص برمجي مفتوح المصدر
بروح TradingView الحقيقية، قام مبتكر هذا النص البرمجي بجعله مفتوح المصدر، بحيث يمكن للمتداولين مراجعة وظائفه والتحقق منها. شكرا للمؤلف! بينما يمكنك استخدامه مجانًا، تذكر أن إعادة نشر الكود يخضع لقواعد الموقع الخاصة بنا.
إخلاء المسؤولية
لا يُقصد بالمعلومات والمنشورات أن تكون، أو تشكل، أي نصيحة مالية أو استثمارية أو تجارية أو أنواع أخرى من النصائح أو التوصيات المقدمة أو المعتمدة من TradingView. اقرأ المزيد في شروط الاستخدام.