xBrat Slingshot
Long trade
If False Breakout Stochastics (Stoch) closes below 20%, and then closes above 80%, identify a swing low as the lowest price reached since the close below 20%.
When Stoch then closes back down below N%, the algorithm will identify a swing high as the highest price reached since the close above 80.
Behind the chart the software draws a fib retracement from swing low to swing high.
If price ever closed below the 61.8 at any time between the swing high bar and the bar that closed below N%, the software cancels the setup (and undraws pullback zone visuals).
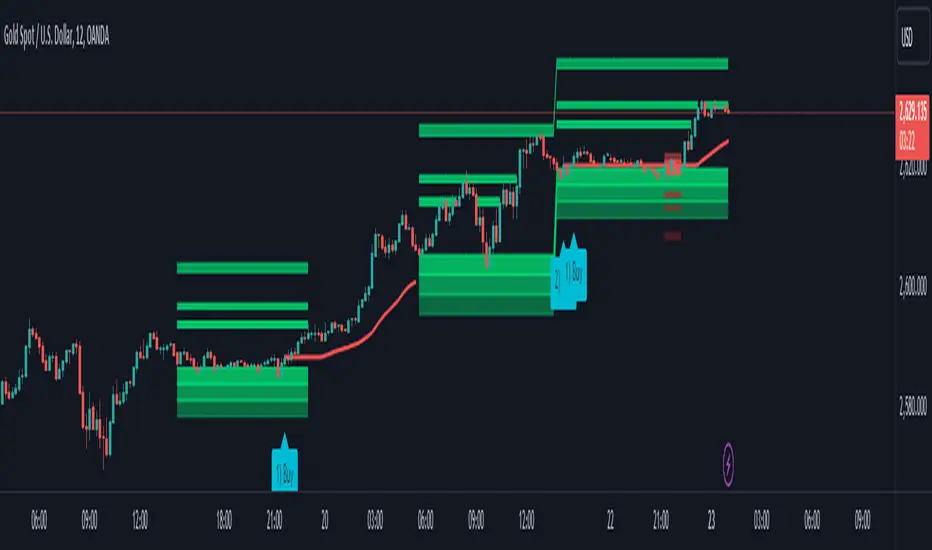
Otherwise our software draws pullback zones at the following fib percentages that are commonly used when measuring pullbacks against a trend.
Pullback zone 1: 23.6-38.2 (default green, light opacity)
Pullback zone 2: 38.2-50 (default green, medium opacity)
Pullback zone 3: 50-61.8 (default green, dark opacity)
If price enters (either closes inside of or touches) a pullback zone and then closes above it without ever closing past (below) it, the setup is confirmed and fib extension targets are drawn (distance from high swing to end of the pullback, extended from the end of the pullback):
Target zone 1: 110-127 (default green, light opacity)
Target zone 2: 161-176 (default green, medium opacity)
Target zone 3: 262-286 (default green, dark opacity)
If price closes past (below) Pullback zone 3 before the setup is confirmed, cancel the setup (and undraw visuals).
Once target zones are drawn, the setup is confirmed and never undrawn.
Short trade
Reverse of the above long trade logic.
Pullback confirmation value: N%
Default zone colour: Red
Once the pullback zone is identified and sufficient initial Support or Resistance occurs within the pullback zones, they are locked along with the target Target Zones for the current move.
Then further confluences are used with our proprietary logic to identify 3 types of Trading Signals. Just because we have a pullback during a trend, doesn't mean we are going to get straight back to the trend. We have identified 2 special sets of confluences that occur in a predefined order to ensure the trend is being returned to with momentum.
These are the Type 1 and Type 2 Trading Signals Below. Then we have another set of circumstances/confluence for when a Trend Fails and traders need to be able to trade these. This is the 3rd type of Trade, a Type 3 below.
Type 1 Trade Signals - Trend Continuation - The following MUST occur within the 3 pullback zones. This signal uses Crosses of Fast and Slow EMA’s which denote the switch back for slingshot and the trend to resume in its original direction after a measured pullback. Then we apply our proprietary EMA cloud for moving out of the pull back zones as a final confirmation for the signal to be Printed.
Type 1 Buy Signals: Fast EMA (default period N, displacement 0) closes below the slow EMA (default period N, displacement N) while in a green pullback zone, and then the fast EMA closes back above the slow EMA without price ever breaking below the last pullback zone (green zones must still be printing). Draw a horizontal line N ticks for entry above the close of the confirmation bar and extend until the lower EMA cloud line breaks it – at which point the lower EMA cloud line is shown as trailing stop
Type 1 Sell Signals: Fast EMA (default period N, displacement 0) closes above the slow EMA (default period N, displacement N) while in a red pullback zone, and then the fast EMA closes back below the slow EMA without price ever breaking above the last pullback zone (red zones must still be printing). Draw a horizontal line N ticks below the close of the confirmation bar and extend until the upper EMA cloud line breaks it – at which point the upper EMA cloud line is shown as trailing stop.
These are the most common of the trading signals when price action follows all of our standard logic rules for a pullback and starts to return in the direction of the main trend after the measured pullback. The highest probability move is to Target 2.
Type 2 Trades - Trend Continuation - For this signal type the Fast and Slow EMA’s DO NOT Cross. BUT price action has to Enter our proprietary EMA cloud and close in the cloud. Then on a set “N” bars must move back out and close outside of the EMA Cloud back in the direction of the original trend. Again, All this must be done within the Pull back Zones.
Type 2 Buy Signal: A bar closes below the upper cloud line while in a green pullback zone, and then within N bars, a bar closes above the upper cloud line without ever breaking below the last pullback zone or the lower EMA Cloud line (green zones must still be printing). Draw a horizontal line N ticks above the close of this bar and extend until the lower EMA cloud line breaks it – at which point the lower EMA cloud line is shown as trailing stop.
Type 2 Sell Signal: A bar closes above the lower cloud line while in a red pullback zone, and then within N bars, a bar closes below the lower cloud line without ever breaking above the last pullback zone or upper EMA cloud line (red zones must still be printing). Draw a horizontal line N ticks below the close of this bar and extend until the upper cloud line breaks it – at which point the upper cloud line is shown as trailing stop.
These are Shallow pullbacks, but still hit the pullback zones. The price action in this instance returns to the direction of the main trend more quickly but still follows a different set of rules to that of Type 1 trades. The Highest Probability move is to target Two
Type 3 Trades - Trend failure - These are trend failure signals where the pullback zones are printed but the price action does not return to the main trend, BUT breaks the third pullback zone and breaks the slingshot rules for a Trend following trade setup. Our proprietary EMA Cloud positioning is then used to confirm and print the signal once the leading edge( direction dependent) moves out of the last pullback zone and we get a candle close with “N” percentage of the pull backs zone's depth.
Type 3 Buy Signal: A bar closes above the highest red pullback zone without pricing previously having ever touched the first red target zone for previous short with trend move. Draw a horizontal line N ticks above the close of the bar that broke the last zone and extend until the lower cloud line breaks it – at which point the lower cloud line is shown as a trailing stop.
Type 3 Sell Signal: A bar closes below the lowest green pullback zone without pricing having ever touched the previous first green target zone for previous long with trend move. Draw a horizontal line N ticks below the close of the bar that broke the last zone and extend until the upper cloud line breaks it – at which point the upper cloud line is shown as a trailing stop.
The Trailing Stop Line is also printed to help with trade management of these 3 different types of trades. This EMA trailing stop is adjustable.
This strategy is designed for Scalping, Day Trading and even Swing Trading. Works with Forex, Crypto, Futures and Stocks.
نص برمجي للمستخدمين المدعوين فقط
يمكن فقط للمستخدمين الذين تمت الموافقة عليهم من قبل المؤلف الوصول إلى هذا البرنامج النصي. ستحتاج إلى طلب الإذن والحصول عليه لاستخدامه. يتم منح هذا عادةً بعد الدفع. لمزيد من التفاصيل، اتبع تعليمات المؤلف أدناه أو اتصل ب xBratSoftwareSolutions مباشرة.
لا توصي TradingView بالدفع مقابل برنامج نصي أو استخدامه إلا إذا كنت تثق تمامًا في مؤلفه وتفهم كيفية عمله. يمكنك أيضًا العثور على بدائل مجانية ومفتوحة المصدر في نصوص مجتمعنا.
تعليمات المؤلف
إخلاء المسؤولية
نص برمجي للمستخدمين المدعوين فقط
يمكن فقط للمستخدمين الذين تمت الموافقة عليهم من قبل المؤلف الوصول إلى هذا البرنامج النصي. ستحتاج إلى طلب الإذن والحصول عليه لاستخدامه. يتم منح هذا عادةً بعد الدفع. لمزيد من التفاصيل، اتبع تعليمات المؤلف أدناه أو اتصل ب xBratSoftwareSolutions مباشرة.
لا توصي TradingView بالدفع مقابل برنامج نصي أو استخدامه إلا إذا كنت تثق تمامًا في مؤلفه وتفهم كيفية عمله. يمكنك أيضًا العثور على بدائل مجانية ومفتوحة المصدر في نصوص مجتمعنا.