PROTECTED SOURCE SCRIPT
Daily Data
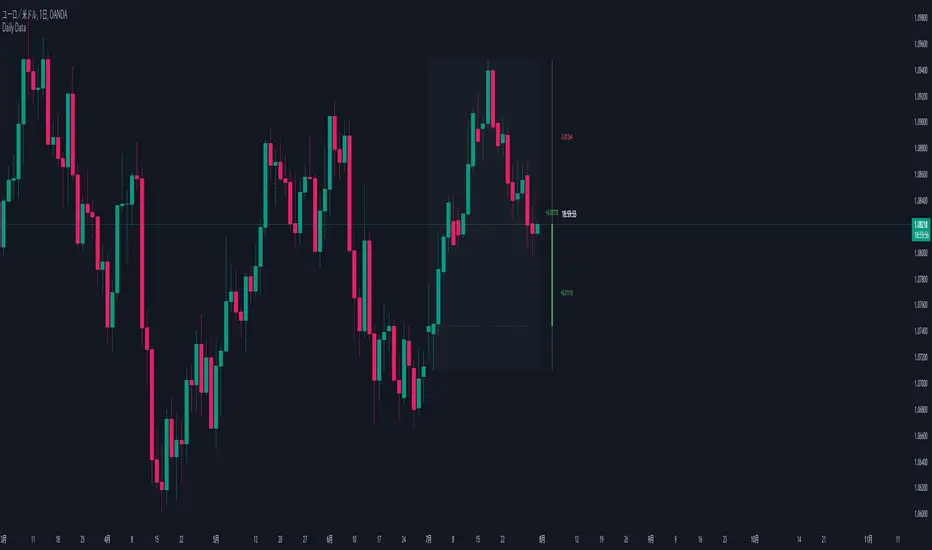
1. Purpose:
This indicator visualizes higher timeframe data on lower timeframe charts, facilitating multi-timeframe analysis. It recreates and extends the functionality of the MQL indicator of the same name in PineScript.
2. Key Features:
a. Higher Timeframe Candle Display:
- Displays monthly data by default, but users can select any timeframe.
- Customizable candle colors (bullish/bearish), wick, and body sizes.
- Adjustable offset to change display position on the chart.
b. Price Range Box:
- Shows the high and low range of the higher timeframe as a semi-transparent box.
- Customizable background color.
c. Fibonacci Levels:
- Displays 7 Fibonacci levels within the higher timeframe price range (0, 23.6%, 38.2%, 50%, 61.8%, 78.6%, 100%).
- Uses different colors for each level and shows level values as labels.
- Can be toggled on/off.
d. Information Labels:
- Remaining Time Display: Countdown to the end of the current higher timeframe candle.
- Delta Display: Shows price change from the open of the current higher timeframe.
- Distance from High/Low: Displays the difference between current price and high/low.
- Each label can be customized for visibility and color.
3. Special Features:
- Displays "MARKET IS CLOSED" when the market is not open.
- Time display format includes months, days, hours, minutes, and seconds, abbreviated as needed.
- Delta and distance values change color based on positive/negative values and are displayed with up/down arrows.
4. Customizability:
- Extensive input options allow users to fine-tune appearance and functionality.
- Individual settings for colors, sizes, offsets, and display items.
نص برمجي محمي
تم نشر هذا النص البرمجي كمصدر مغلق. ومع ذلك، يمكنك استخدامه بحرية ودون أي قيود - تعرف على المزيد هنا.
إخلاء المسؤولية
لا يُقصد بالمعلومات والمنشورات أن تكون، أو تشكل، أي نصيحة مالية أو استثمارية أو تجارية أو أنواع أخرى من النصائح أو التوصيات المقدمة أو المعتمدة من TradingView. اقرأ المزيد في شروط الاستخدام.