PROTECTED SOURCE SCRIPT
تم تحديثه [Daily] CRT with OHLC Reference
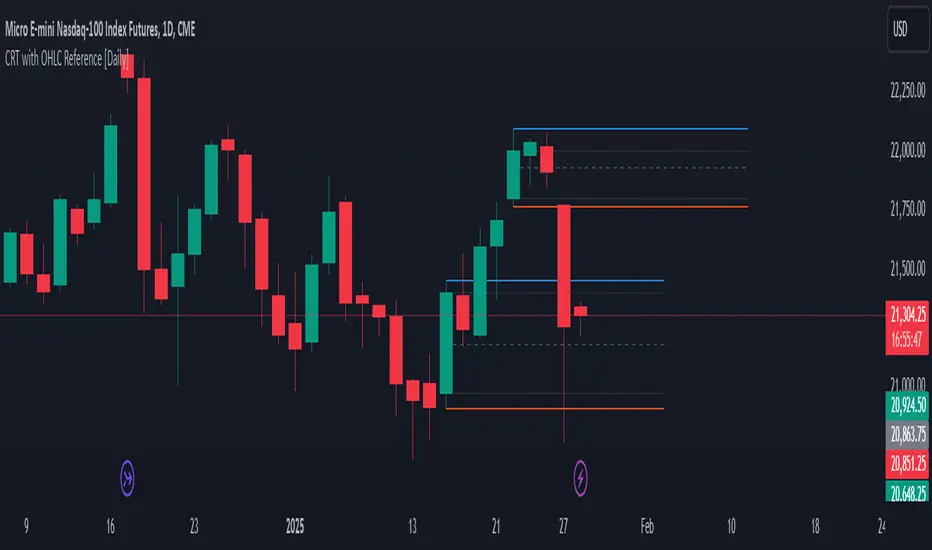
Here’s a breakdown of Daily CRT:
1. What is Daily CRT?
Daily CRT focuses on the price action of daily candles, treating them as ranges that can be broken or manipulated.
The theory suggests that certain candles on the daily chart form ranges that act as key levels for price expansion or reversal.
These ranges are not just simple support and resistance levels but are tied to the concept of liquidity draws, where price is likely to move towards areas where liquidity is concentrated (e.g., highs, lows, or key levels).
2. Key Components of Daily CRT
Ranging Candle: The first candle in the CRT setup establishes the range. This candle’s high and low become the key levels to watch.
Manipulation Candle: The second candle often manipulates the range by either breaking it or testing it. This is where turtle soup (false breakouts) can occur.
Distribution Candle: The third candle is where the price either confirms the breakout or reverses, leading to a potential expansion in the opposite direction.
3. How to Use Daily CRT
Identify the Range: On the daily chart, identify a candle that forms a clear range (high and low). This is your Ranging Candle.
Watch for Manipulation: The next candle (Manipulation Candle) will often test or break the range. If it breaks the range but then reverses back inside, it’s a turtle soup (false breakout), indicating a potential reversal.
Trade the Distribution: The third candle (Distribution Candle) is where you look for confirmation. If the price breaks the range and continues in the same direction, it’s a true breakout. If it reverses, it’s a false breakout, and you can trade the reversal.
4. Daily CRT and Key Levels
Daily CRT works best when combined with higher timeframe key levels (e.g., weekly or monthly highs/lows, order blocks, fair value gaps, etc.).
The daily candle ranges often align with these key levels, providing confluence for potential reversals or expansions.
5. Time Alignment in Daily CRT
Time is a critical factor in CRT. The PDF emphasizes that the highest probability CRT setups occur at specific times of the day or week.
For example, the purge (breakout or reversal) of a daily CRT often happens during key trading sessions (e.g., London open, New York open).
6. Practical Steps for Daily CRT
Determine the Draw on Liquidity: Use higher timeframe analysis (weekly or monthly) to identify where price is likely to move (e.g., towards a key level or liquidity pool).
Identify the Daily Range: On the daily chart, mark the high and low of the ranging candle.
Watch for Manipulation: Observe the next candle to see if it breaks the range or tests it. Look for signs of turtle soup (false breakouts).
Trade the Distribution: Once the third candle confirms the direction (either breakout or reversal), enter the trade with proper risk management.
7. Example of Daily CRT
Ranging Candle: On Monday, a daily candle forms a range between 1.1000 (low) and 1.1100 (high).
Manipulation Candle: On Tuesday, the price breaks below 1.1000 but then reverses back above it, forming a turtle soup (false breakout).
Distribution Candle: On Wednesday, the price confirms the reversal by breaking above 1.1100, signaling a potential bullish expansion.
8. Integration with Other Concepts
Daily CRT should not be used in isolation. It works best when combined with other ICT concepts like:
Market Profiles: Understanding whether the market is in a ranging, expansion, or reversal phase.
Orderflow: Identifying bullish or bearish orderflow to confirm the direction of the CRT.
Key Levels: Using higher timeframe key levels to add confluence to the CRT setup.
Time: Aligning the CRT with key times (e.g., London open, New York open) for higher probability setups.
9. Risk Management in Daily CRT
Always use proper risk management when trading CRT setups. The PDF suggests risking no more than 0.5% of your account per trade.
Use stop-losses and position sizing to protect your capital, especially since CRT setups can involve false breakouts (turtle soups).
10. Summary
Daily CRT is a powerful tool for identifying key levels and potential price expansions or reversals on the daily chart.
It involves analyzing three key candles: the Ranging Candle, the Manipulation Candle, and the Distribution Candle.
The theory is most effective when combined with higher timeframe key levels, market profiles, orderflow, and proper time alignment.
By mastering Daily CRT, you can improve your ability to predict market movements and frame high-probability trades.
ملاحظات الأخبار
converted to v6ملاحظات الأخبار
add labels to turn on and off نص برمجي محمي
تم نشر هذا النص البرمجي كمصدر مغلق. ومع ذلك، يمكنك استخدامه بحرية ودون أي قيود - تعرف على المزيد هنا.
Doer
إخلاء المسؤولية
لا يُقصد بالمعلومات والمنشورات أن تكون، أو تشكل، أي نصيحة مالية أو استثمارية أو تجارية أو أنواع أخرى من النصائح أو التوصيات المقدمة أو المعتمدة من TradingView. اقرأ المزيد في شروط الاستخدام.
نص برمجي محمي
تم نشر هذا النص البرمجي كمصدر مغلق. ومع ذلك، يمكنك استخدامه بحرية ودون أي قيود - تعرف على المزيد هنا.
إخلاء المسؤولية
لا يُقصد بالمعلومات والمنشورات أن تكون، أو تشكل، أي نصيحة مالية أو استثمارية أو تجارية أو أنواع أخرى من النصائح أو التوصيات المقدمة أو المعتمدة من TradingView. اقرأ المزيد في شروط الاستخدام.