[DisDev] Market Maker | Sessions | Initial Balance | Range Stats
Each component is explained and demonstrated how it could be utilized as a trading tool.
The basis of this indicator is to analyze session-specific price movements through automatic display and statistics.
Key:
Dotted lines = Developing Session
Solid Line = Session complete
Dashed lines = Past Session
1) The primary function is the five manual time-session inputs. These sessions could be based on a full market period, such as London Open to Close (0800 UTC to 1630 UTC), the Initial Balance of the day (0000 UTC to 0100 UTC), or a session Initial Balance New York (1430 UTC to 1530 UTC). The user can update settings input text to reflect this on the chart.
The following shows the example noted above, with the added subcomponents of:
• Shaded areas to define each session
• Extension of the Sessions highs and lows (extension 24/48/72-hour options)
• Future line projection (provides a reminder of when the market opens)
This allows you to see potential levels of resistance and support and market open volatility.
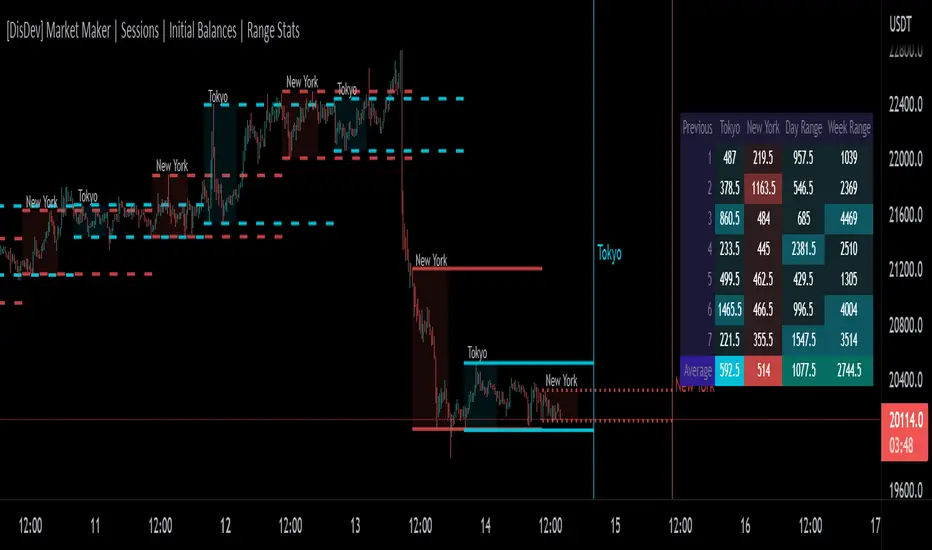
The below example shows the input sessions configured for five Session Initial Balances. You can see that the Sessions Initial Balances were in a tight price range. A range breakout occurred with price move of $1400 visualized.
2) The secondary function is the Range statistics. Range statistics can be used to track the volatility of each session, day or week and can be selected for up to 31 days. This helps the user to determine overbought or oversold conditions as well as pattern recognition.
Trade Example 1
Settings: New York Session Open to Session Close.
The colored boxes are manually drawn to emphasize how the New York Lows and Highs can act as a confluence for support and resistance areas.
Trade Example 2a
Settings: London Session Open to Session Close and New York Session Open to Session Close.
This chart shows how the Session Open (in this case, the New York Open) reminder notifies you that there could be volatility when a new session opens.
Trade Example 2b
Notice how price breaks to the upside at the opening of the New York session. In this instance it was a $2,250 or 5.17% increase in the opening hour.
3. Once London closes New York has control of the market; one push-up stops out the shorts that placed stop losses at the London high, then brings price back down to the mean.
By having the reminder lines and shaded sessions, the user is prepared and can anticipate some price reaction, often a reversal if price has been steadily moving in one direction.
Option configured so the opacity of the Shade Session can be changed by the user.
نص برمجي للمستخدمين المدعوين فقط
يمكن فقط للمستخدمين الذين تمت الموافقة عليهم من قبل المؤلف الوصول إلى هذا البرنامج النصي. ستحتاج إلى طلب الإذن والحصول عليه لاستخدامه. يتم منح هذا عادةً بعد الدفع. لمزيد من التفاصيل، اتبع تعليمات المؤلف أدناه أو اتصل ب DisDev مباشرة.
لا توصي TradingView بالدفع مقابل برنامج نصي أو استخدامه إلا إذا كنت تثق تمامًا في مؤلفه وتفهم كيفية عمله. يمكنك أيضًا العثور على بدائل مجانية ومفتوحة المصدر في نصوص مجتمعنا.
تعليمات المؤلف
إخلاء المسؤولية
نص برمجي للمستخدمين المدعوين فقط
يمكن فقط للمستخدمين الذين تمت الموافقة عليهم من قبل المؤلف الوصول إلى هذا البرنامج النصي. ستحتاج إلى طلب الإذن والحصول عليه لاستخدامه. يتم منح هذا عادةً بعد الدفع. لمزيد من التفاصيل، اتبع تعليمات المؤلف أدناه أو اتصل ب DisDev مباشرة.
لا توصي TradingView بالدفع مقابل برنامج نصي أو استخدامه إلا إذا كنت تثق تمامًا في مؤلفه وتفهم كيفية عمله. يمكنك أيضًا العثور على بدائل مجانية ومفتوحة المصدر في نصوص مجتمعنا.