OPEN-SOURCE SCRIPT
Renminbi Peg Band
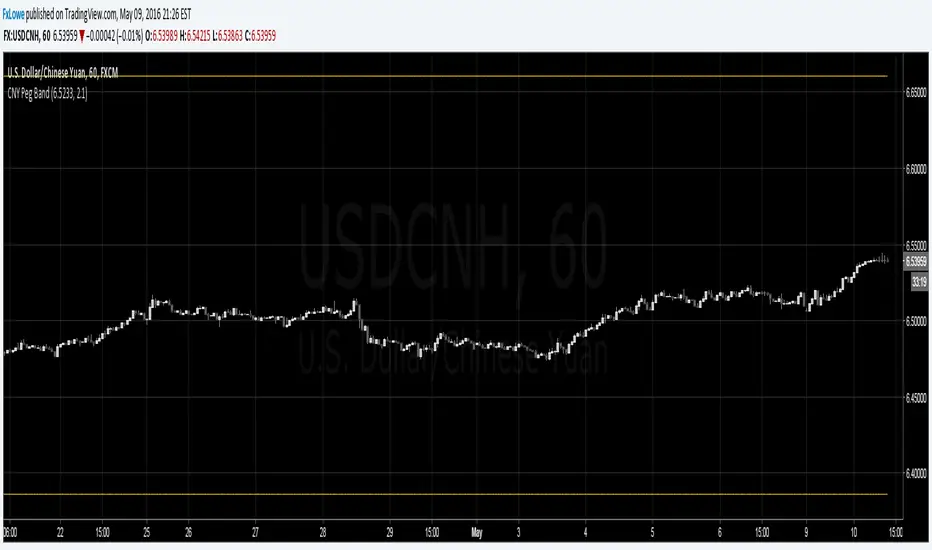
Simple script to draw the upper and lower bands based on the % tolerance the PBOC has set around their reference rate.
Right now, reference rate and % tolerance are input variables that must be input/updated manually. Hopefully one day Tradingview allows the automatic update to be scripted.
Right now, reference rate and % tolerance are input variables that must be input/updated manually. Hopefully one day Tradingview allows the automatic update to be scripted.
نص برمجي مفتوح المصدر
بروح TradingView الحقيقية، قام مبتكر هذا النص البرمجي بجعله مفتوح المصدر، بحيث يمكن للمتداولين مراجعة وظائفه والتحقق منها. شكرا للمؤلف! بينما يمكنك استخدامه مجانًا، تذكر أن إعادة نشر الكود يخضع لقواعد الموقع الخاصة بنا.
إخلاء المسؤولية
لا يُقصد بالمعلومات والمنشورات أن تكون، أو تشكل، أي نصيحة مالية أو استثمارية أو تجارية أو أنواع أخرى من النصائح أو التوصيات المقدمة أو المعتمدة من TradingView. اقرأ المزيد في شروط الاستخدام.