OPEN-SOURCE SCRIPT
Mayer Multiple (with muti-color histogram)
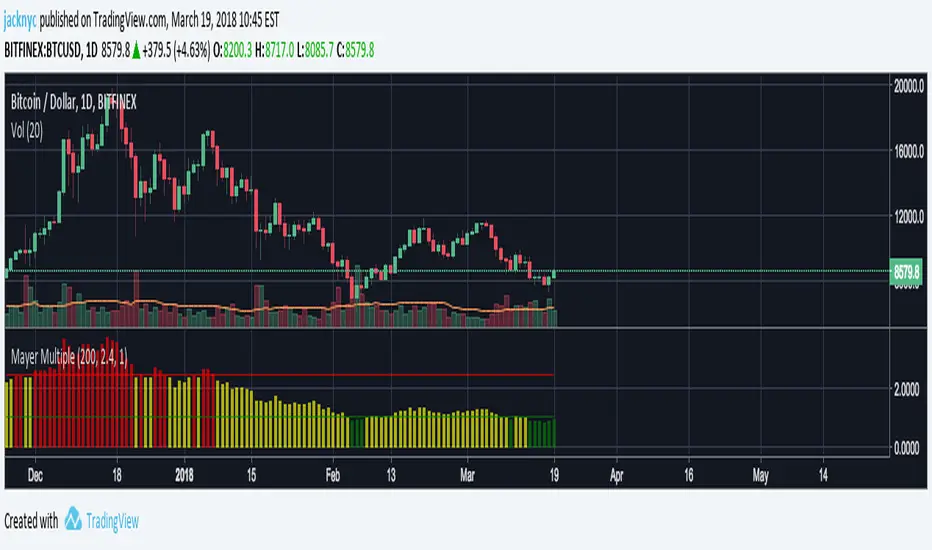
This is inspired by unbound's work on the Mayer Multiple script.
This script is designed to work with the daily chart.

I created this script so you can see the daily Mayer Multiple by just hovering over the bar in the histogram. I modified the color of the histogram bar to indicate the following:
Red = Over 2.4x Mayer Multiple, overvalued
Yellow = Between 1x to 2.4x Mayer Mutiple, fairly valued
Green = Under 1x Mayer Multiple, undervalued
This is my first script so let me know if there are any issues or suggestions on how to change it.
This script is designed to work with the daily chart.
I created this script so you can see the daily Mayer Multiple by just hovering over the bar in the histogram. I modified the color of the histogram bar to indicate the following:
Red = Over 2.4x Mayer Multiple, overvalued
Yellow = Between 1x to 2.4x Mayer Mutiple, fairly valued
Green = Under 1x Mayer Multiple, undervalued
This is my first script so let me know if there are any issues or suggestions on how to change it.
نص برمجي مفتوح المصدر
بروح TradingView الحقيقية، قام مبتكر هذا النص البرمجي بجعله مفتوح المصدر، بحيث يمكن للمتداولين مراجعة وظائفه والتحقق منها. شكرا للمؤلف! بينما يمكنك استخدامه مجانًا، تذكر أن إعادة نشر الكود يخضع لقواعد الموقع الخاصة بنا.
إخلاء المسؤولية
لا يُقصد بالمعلومات والمنشورات أن تكون، أو تشكل، أي نصيحة مالية أو استثمارية أو تجارية أو أنواع أخرى من النصائح أو التوصيات المقدمة أو المعتمدة من TradingView. اقرأ المزيد في شروط الاستخدام.