OPEN-SOURCE SCRIPT
Grayscale GSOL Solana Financials [NeoButane]
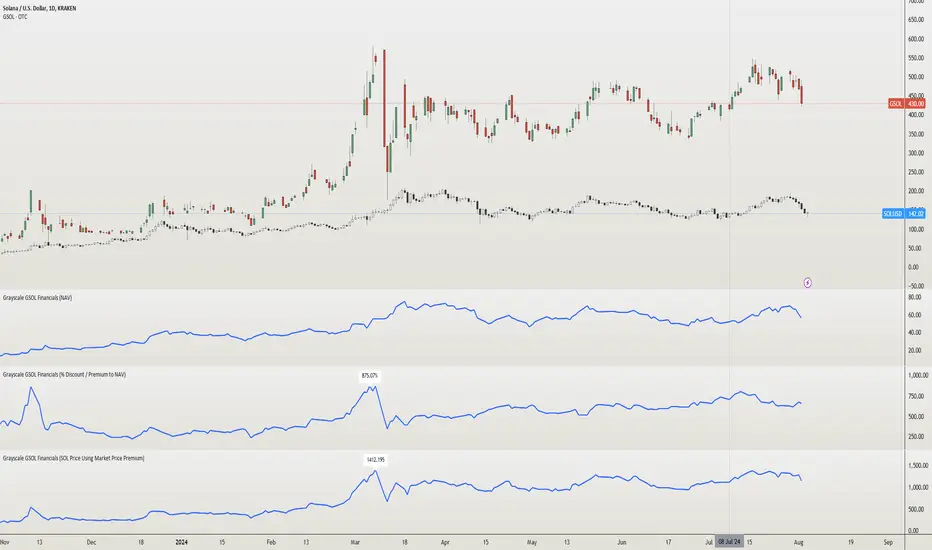
This script shows Grayscale's GSOL financials based on the information from their website. Investors and traders like to use financials when making the decision to buy, sell, or hold.
►Usage
This script is specific to GSOL. Investors and traders use financials when making the decision to buy, sell, or hold. How one interprets financials is up to the individual. For example, investors who believe a Solana ETF is coming soon can view the "% Discount / Premium to NAV", which is currently over 600%, and decide not to buy because the premium would collapse if an ETF began trading.

►Configuration
Data select the data you'd like to display.
Show Highest label show the highest value of the entire data set.
Line Color an expression of self.
Extrapolate Data Using Average or Last Known Value Shows a line beyond the dataset, using the average of all past data or the last data point to predict newer data. % Discount / Premium to NAV, Share Premium, and SOL Per Share are supported.
→Data retrieved from Grayscale
AUM assets under management.
NAV net asset value.
Market Price market price of GSOL.
Shares Outstanding number of shares held in the open market.
→Data retrieved from Grayscale, modified by me
% Discount / Premium to NAV the % away NAV is from the market price of GSOL.
Formula: (GSOL - NAV) / NAV
Share Premium the actual $ premium of GSOL to its NAV.
Formula: GSOL - NAV
SOL Per Share the amount of SOL 1 share of GSOL can redeem. This is derived using Kraken's SOLUSD daily close prices.
Formula: Kraken's SOLUSD / NAV
SOL Price Using Market Price Premium the price of SOL if GSOL's market price was "correct" and the SOL Per Share ratio remained the same.
Formula: GSOL / SOL Per Share
►How this works
Grayscale has a spreadsheet of historical data available on their GSOL page. Since financials are not available for OTC:GSOL, I placed all the data into arrays to emulate a symbol's price (y) coordinates. UNIX time for each day, also in an array, is used as the time (x) coordinates. The UNIX arrays and data arrays are then looped to plot as lines, with data y2 being the next data point, making it appear as a continuous line.
Grayscale's GSOL was downloaded spreadsheet and opened in Excel. SOLUSD prices were exported using TradingView export function. The output of information was pasted into Pine Script. For matching up Kraken's SOLUSD prices to each Grayscale's data since GSOL does not trade daily, dates were converted to UNIX and matched with xlookup(). A library or seed will be used in the future for updating.
References
Data retrieved from Grayscale's website 2024/08/04.
grayscale.com/crypto-products/grayscale-solana-trust
Quantity of Solana held by the trust can be seen in their filings. Ctrl + F "Quantity of
SOL "
grayscale.com/documents
Q1 2024: grayscale.com/globalassets/documents/otc/sol/sol_quarterly_03312024_as-filed.pdf
The high premium can partly be explained by private placement currently being closed. This means private sales can't dilute share value.
etf.com/sections/news/why-grayscales-solana-trust-trading-10x-premium
►Usage
This script is specific to GSOL. Investors and traders use financials when making the decision to buy, sell, or hold. How one interprets financials is up to the individual. For example, investors who believe a Solana ETF is coming soon can view the "% Discount / Premium to NAV", which is currently over 600%, and decide not to buy because the premium would collapse if an ETF began trading.
►Configuration
Data select the data you'd like to display.
Show Highest label show the highest value of the entire data set.
Line Color an expression of self.
Extrapolate Data Using Average or Last Known Value Shows a line beyond the dataset, using the average of all past data or the last data point to predict newer data. % Discount / Premium to NAV, Share Premium, and SOL Per Share are supported.
→Data retrieved from Grayscale
AUM assets under management.
NAV net asset value.
Market Price market price of GSOL.
Shares Outstanding number of shares held in the open market.
→Data retrieved from Grayscale, modified by me
% Discount / Premium to NAV the % away NAV is from the market price of GSOL.
Formula: (GSOL - NAV) / NAV
Share Premium the actual $ premium of GSOL to its NAV.
Formula: GSOL - NAV
SOL Per Share the amount of SOL 1 share of GSOL can redeem. This is derived using Kraken's SOLUSD daily close prices.
Formula: Kraken's SOLUSD / NAV
SOL Price Using Market Price Premium the price of SOL if GSOL's market price was "correct" and the SOL Per Share ratio remained the same.
Formula: GSOL / SOL Per Share
►How this works
Grayscale has a spreadsheet of historical data available on their GSOL page. Since financials are not available for OTC:GSOL, I placed all the data into arrays to emulate a symbol's price (y) coordinates. UNIX time for each day, also in an array, is used as the time (x) coordinates. The UNIX arrays and data arrays are then looped to plot as lines, with data y2 being the next data point, making it appear as a continuous line.
Grayscale's GSOL was downloaded spreadsheet and opened in Excel. SOLUSD prices were exported using TradingView export function. The output of information was pasted into Pine Script. For matching up Kraken's SOLUSD prices to each Grayscale's data since GSOL does not trade daily, dates were converted to UNIX and matched with xlookup(). A library or seed will be used in the future for updating.
References
Data retrieved from Grayscale's website 2024/08/04.
grayscale.com/crypto-products/grayscale-solana-trust
Quantity of Solana held by the trust can be seen in their filings. Ctrl + F "Quantity of
SOL "
grayscale.com/documents
Q1 2024: grayscale.com/globalassets/documents/otc/sol/sol_quarterly_03312024_as-filed.pdf
The high premium can partly be explained by private placement currently being closed. This means private sales can't dilute share value.
etf.com/sections/news/why-grayscales-solana-trust-trading-10x-premium
نص برمجي مفتوح المصدر
بروح TradingView الحقيقية، قام مبتكر هذا النص البرمجي بجعله مفتوح المصدر، بحيث يمكن للمتداولين مراجعة وظائفه والتحقق منها. شكرا للمؤلف! بينما يمكنك استخدامه مجانًا، تذكر أن إعادة نشر الكود يخضع لقواعد الموقع الخاصة بنا.
My published indicators: tradingview.com/u/NeoButane/
Sorry if I haven't replied to your message yet, I'm a bit backlogged :)
Sorry if I haven't replied to your message yet, I'm a bit backlogged :)
إخلاء المسؤولية
لا يُقصد بالمعلومات والمنشورات أن تكون، أو تشكل، أي نصيحة مالية أو استثمارية أو تجارية أو أنواع أخرى من النصائح أو التوصيات المقدمة أو المعتمدة من TradingView. اقرأ المزيد في شروط الاستخدام.