OPEN-SOURCE SCRIPT
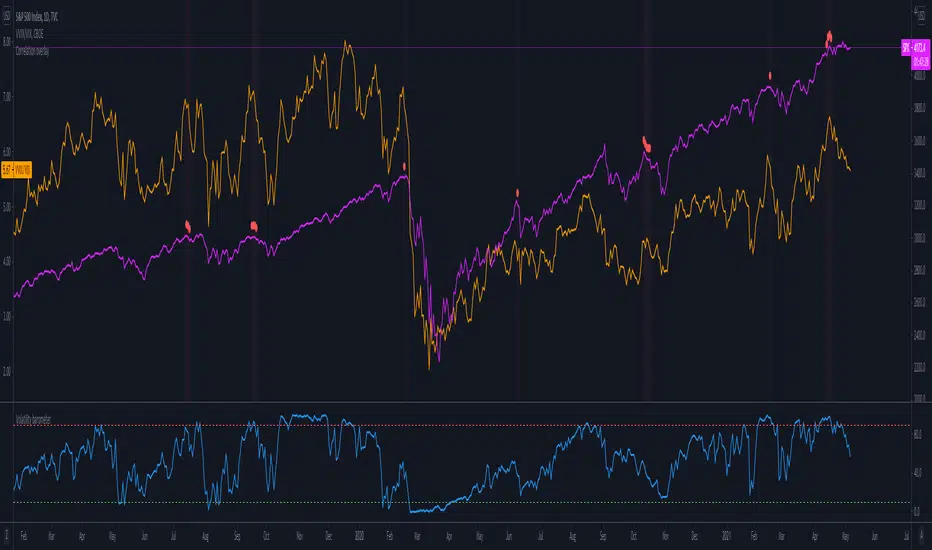
Volatility barometer

It is the indicator that analyzes the behaviour of VIX against CBOE volaility indices (VIX3M, VIX6M and VIX1Y) and VIX futures (next contract to the front one - VX!2). Because VIX is a derivate of SPX, the indicator shall be used on the SPX chart (or equivalent like SPY).
When the readings get above 90 / below 10, it means the market is overbought / oversold in terms of implied volatility. However, it does not mean it will reverse - if the price go higher along with the indicator readings then everything is fine. There is an alarming situation when the SPX is diverging - e.g. the price go higher, the readings lower. It means the SPX does not play in the same team as IVOL anymore and might reverse.
You can use it in conjunction with other implied volatility indicators for stronger signals: the Correlation overlay ( - the indicator that measures the correlation between VVIX and VIX) and VVIX/VIX ratio (it generates a signal the ratio makes 50wk high).
When the readings get above 90 / below 10, it means the market is overbought / oversold in terms of implied volatility. However, it does not mean it will reverse - if the price go higher along with the indicator readings then everything is fine. There is an alarming situation when the SPX is diverging - e.g. the price go higher, the readings lower. It means the SPX does not play in the same team as IVOL anymore and might reverse.
You can use it in conjunction with other implied volatility indicators for stronger signals: the Correlation overlay (

نص برمجي مفتوح المصدر
بروح TradingView الحقيقية، قام مبتكر هذا النص البرمجي بجعله مفتوح المصدر، بحيث يمكن للمتداولين مراجعة وظائفه والتحقق منها. شكرا للمؤلف! بينما يمكنك استخدامه مجانًا، تذكر أن إعادة نشر الكود يخضع لقواعد الموقع الخاصة بنا.
إخلاء المسؤولية
لا يُقصد بالمعلومات والمنشورات أن تكون، أو تشكل، أي نصيحة مالية أو استثمارية أو تجارية أو أنواع أخرى من النصائح أو التوصيات المقدمة أو المعتمدة من TradingView. اقرأ المزيد في شروط الاستخدام.